How We Know · Unit 4 of 4
How We Read
Reading the atoms an organism builds itself out of.
Stable isotopes · δ¹⁵N · δ¹³C · Environmental Biology
Quick — guess.
Where did the nitrogen in this tree come from?
Where did this whale spend last winter? What did this elephant eat? What is the bear in this photo half made of?
Last week we counted. Last class we listened. Yesterday we traced. Today we read. Every atom in an organism's body came from somewhere — a meal, a breath, a drink. The atoms remember where they came from. They carry tiny, measurable signatures of their origin. If you know how to read them, an organism is a written record of everything that built it.
The honest truth
You are what you eat. Literally. Measurably.
Carbon, nitrogen, oxygen — most elements come in more than one kind, called isotopes. A heavy version and a light version. Plants and animals pick up both, but in slightly different ratios depending on where they live and what they eat.
Measure the ratio of heavy to light atoms in a piece of tissue, and you can ask two questions: where did your nutrients come from? and what did you eat?. Two isotopes. Two questions. One organism that wrote it all down on itself.
Two shapes of question
Where did it come from. What did it eat.
"Where did the nutrients come from?"
Did the nitrogen in this tree come from the ocean or from the soil? Was this fish eating algae or eating other fish? How high up the food chain does this animal feed?
Use: nitrogen-15 (δ¹⁵N).
"What did it actually eat?"
Was this animal eating ocean food or land food? Forest plants or grassland plants? How much of this body was built from the sea?
Use: carbon-13 (δ¹³C).
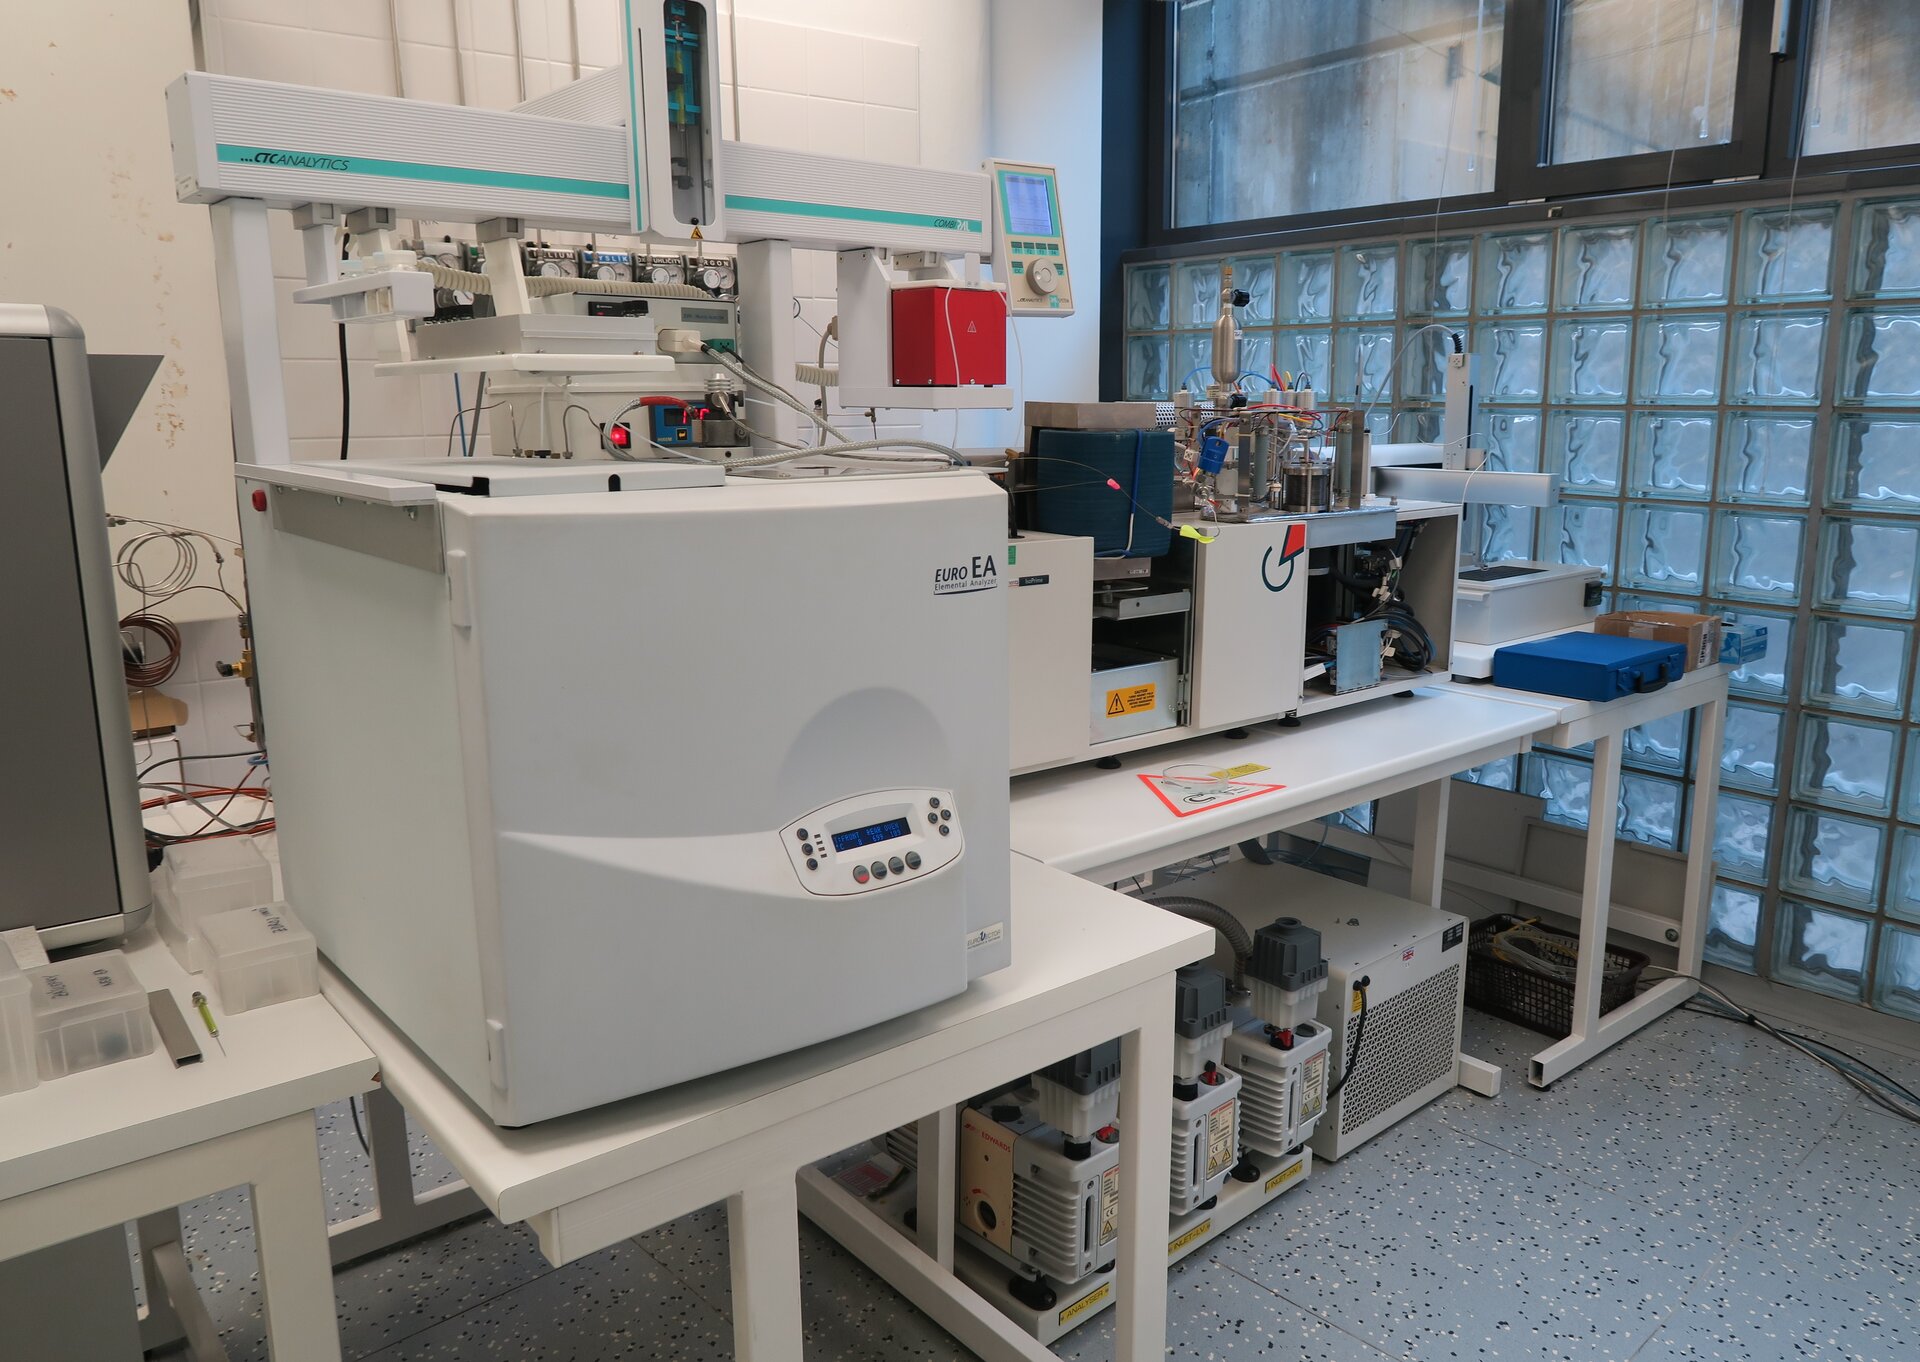
Burn the sample. Count the heavy atoms. A milligram of leaf, hair, bone, or muscle. The instrument burns it down to gas, separates the nitrogen, then counts how many atoms are heavy (¹⁵N) versus light (¹⁴N). The number comes out in parts per thousand — written as δ¹⁵N, "delta-fifteen-N." It tells you, very precisely, where in the food web this tissue was built.
The question it answers
Where in the food web did this body get built?
Every time one organism eats another, the heavier version of nitrogen — ¹⁵N — gets a little more concentrated in the tissue. About three parts per thousand more, every trophic level. Algae are low in ¹⁵N. The small fish that eat the algae are higher. The salmon that eat those fish are higher still. The bear that eats the salmon is highest.
δ¹⁵N is a number you can read like a thermometer for trophic level. It also flags where the nitrogen came from: ocean nitrogen is heavier than land nitrogen, so a tree fed by salmon carcasses looks chemically different from a tree fed only by soil.
δ¹⁵N · three steps
The method.
Collect tissue
A snip of muscle. A bit of hair or fur. A tree-ring core. A bone fragment from a museum drawer. Anything an organism built from nitrogen will work. Dry it. Grind it. Weigh out about one milligram.
Run it through the IRMS
The isotope ratio mass spectrometer combusts the sample, separates the gases, and counts the heavy versus light atoms one at a time. It takes minutes. The output is a single number for that sample.
Read δ¹⁵N in per mille
The number is reported as δ¹⁵N in parts per thousand (‰). Compare it to a reference (algae, soil, baseline). The difference is the trophic position, or the nitrogen origin, or both.
The math is a story
An example.
Plankton at +5. Eat three steps up the food chain — add about 3‰ each step. 5, then 8, then 11, then 14. The salmon's flesh reads +14. The math says: this salmon is three trophic levels above the plankton — algae, then small zooplankton, then small fish, then salmon. The salmon never told us. The atoms did.
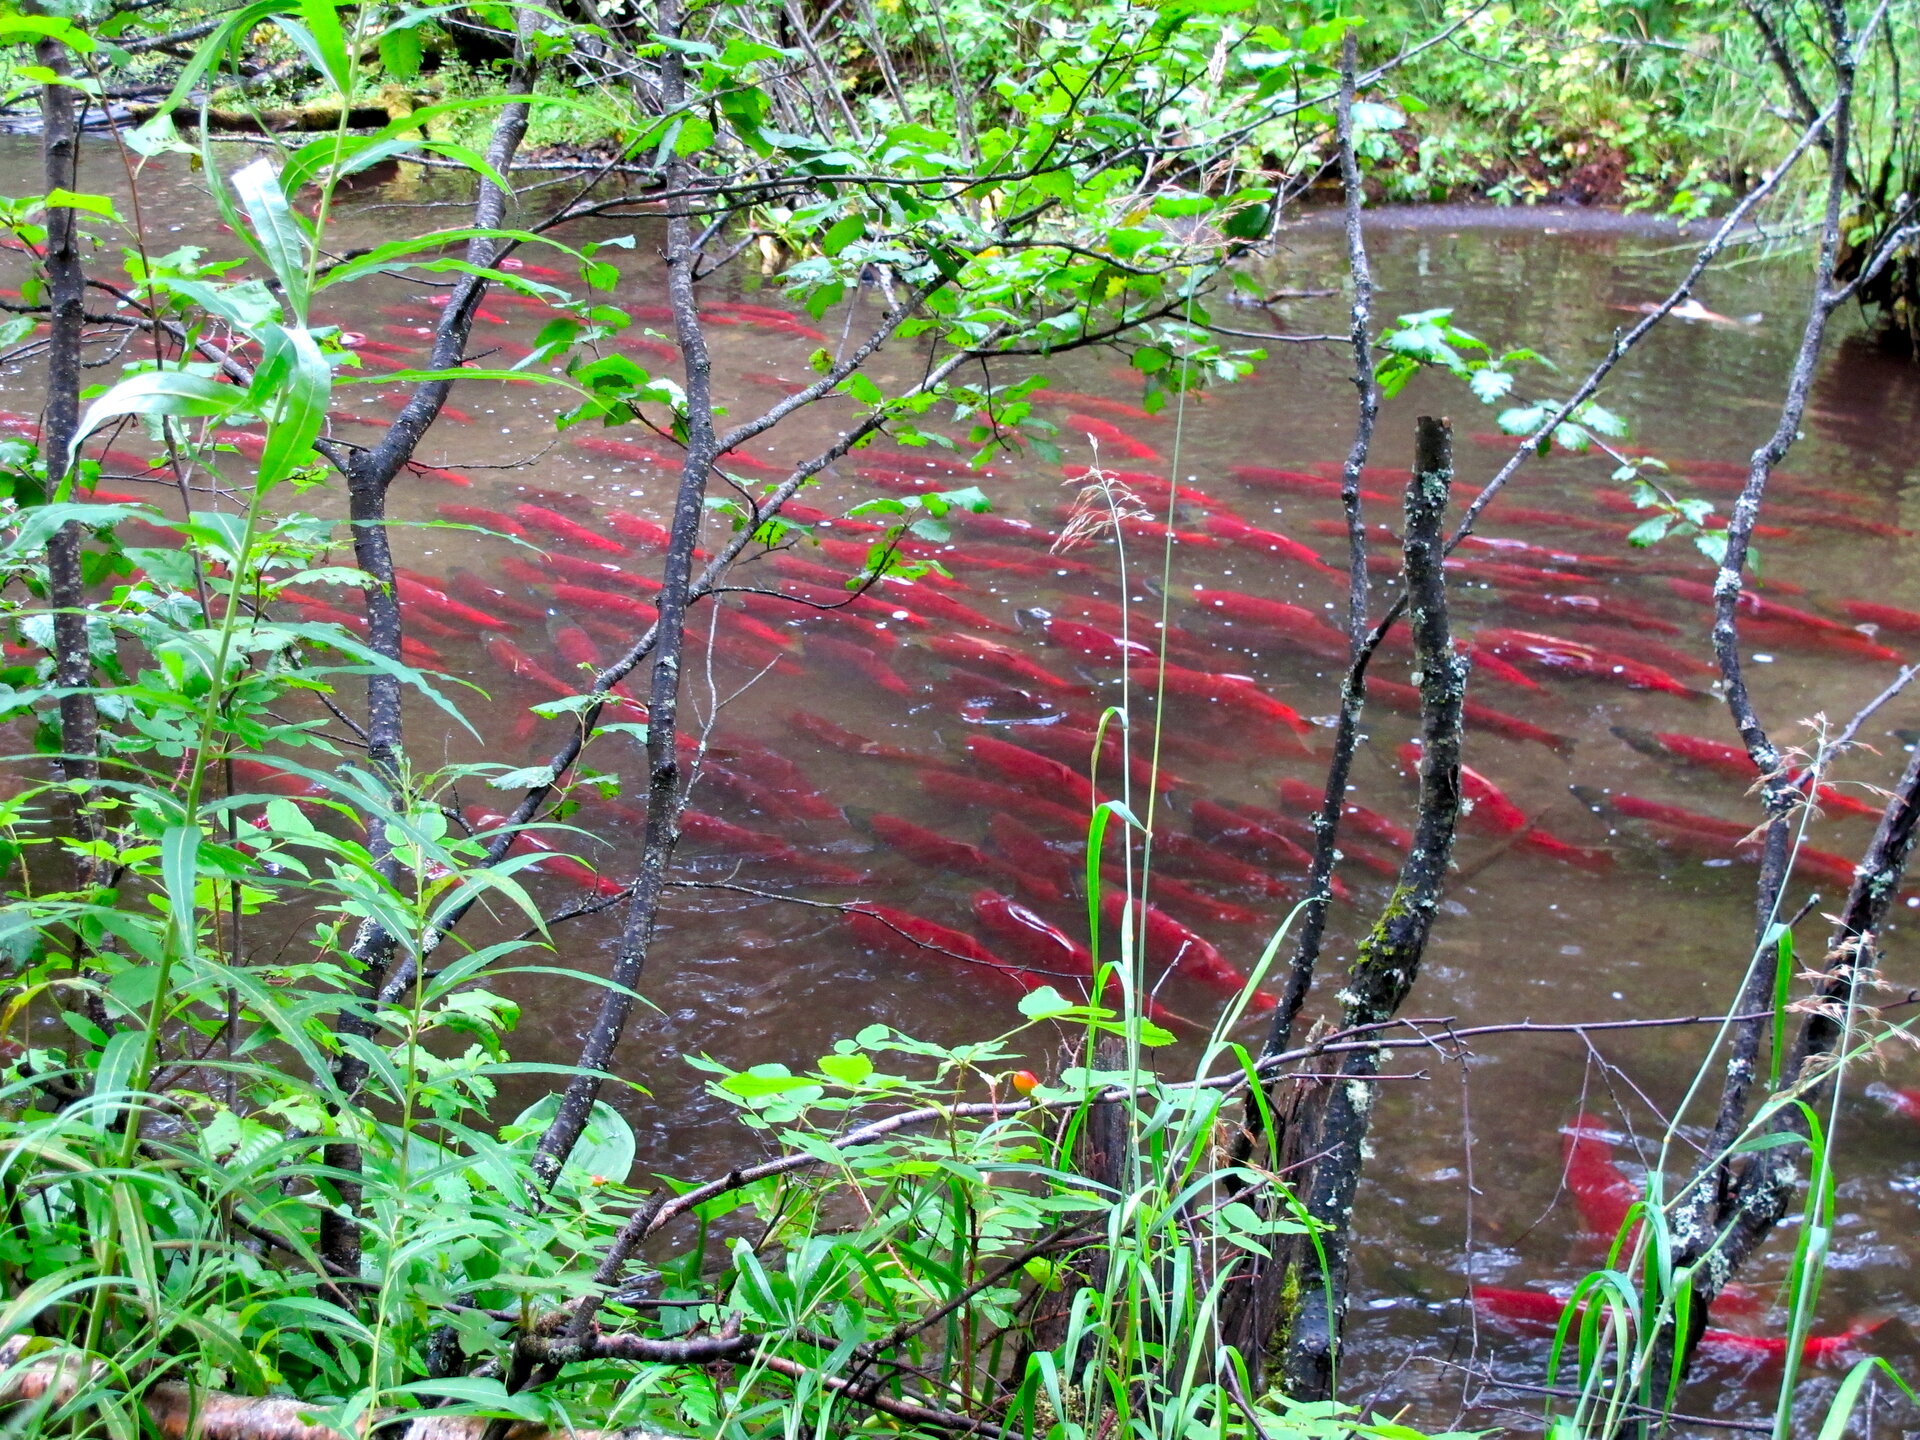
Salmon are ocean built. They die in the forest. The trees grow. Sockeye salmon spend years feeding in the open Pacific. When they return to spawn, they carry tons of marine nitrogen up the streams of British Columbia and Alaska — and die. Bears, eagles, and gulls drag the carcasses into the woods. Helfield and Naiman (2001) measured Sitka spruce within 25 meters of spawning streams: 22 to 24 percent of the trees' foliar nitrogen came from salmon. The marine signature shows up as a δ¹⁵N spike. In some old trees, growth rings carry a salmon record across decades — though the signal is uneven from tree to tree. The forest is being built, in part, out of the sea.
Where else this works
δ¹⁵N is everywhere now.
Lakes & oceans · ongoing
Mercury bioaccumulation
Mercury concentrates as it moves up the food chain. δ¹⁵N tells you how high up a fish or bird is feeding. The higher the δ¹⁵N, the more mercury — every time. Researchers use δ¹⁵N to predict which top predators are most contaminated, and which lakes are safe to eat fish from.
Antarctica · 1900s—today
Seabird food-web shifts
Adelie penguin feathers from museum specimens go back over a century. The δ¹⁵N record shows their diet shifting as krill populations crash and sea ice retreats. The birds switched what they ate — the change shows up in their feathers years before anyone counted krill.
Archaeology · worldwide
Ancient human diets
Bone collagen from skeletons thousands of years old still carries δ¹⁵N. High values mean lots of fish or meat. Low values mean mostly plants. We've reconstructed diets of Vikings, Mayans, and Neanderthals from bones alone. The bodies remembered what they ate.
What it can't tell you · limits
Three things δ¹⁵N can't do.
1. It needs a baseline. A δ¹⁵N value alone is meaningless. You need to know the baseline of the ecosystem the organism lived in. Different lakes, different oceans, different watersheds all start from different δ¹⁵N values, so trophic position is always relative.
2. Pollution can fake the signal. Sewage outfalls, fertilizer runoff, and nearby cattle all change the local nitrogen baseline. A high δ¹⁵N near a treatment plant might be sewage, not high trophic level.
3. It blurs species you can't see. The atoms tell you about trophic position, not species. Two animals that eat very different foods at the same level look the same in δ¹⁵N.
Method two
What about diet? What did this animal actually eat?
Same instrument. Different atom. Different question.
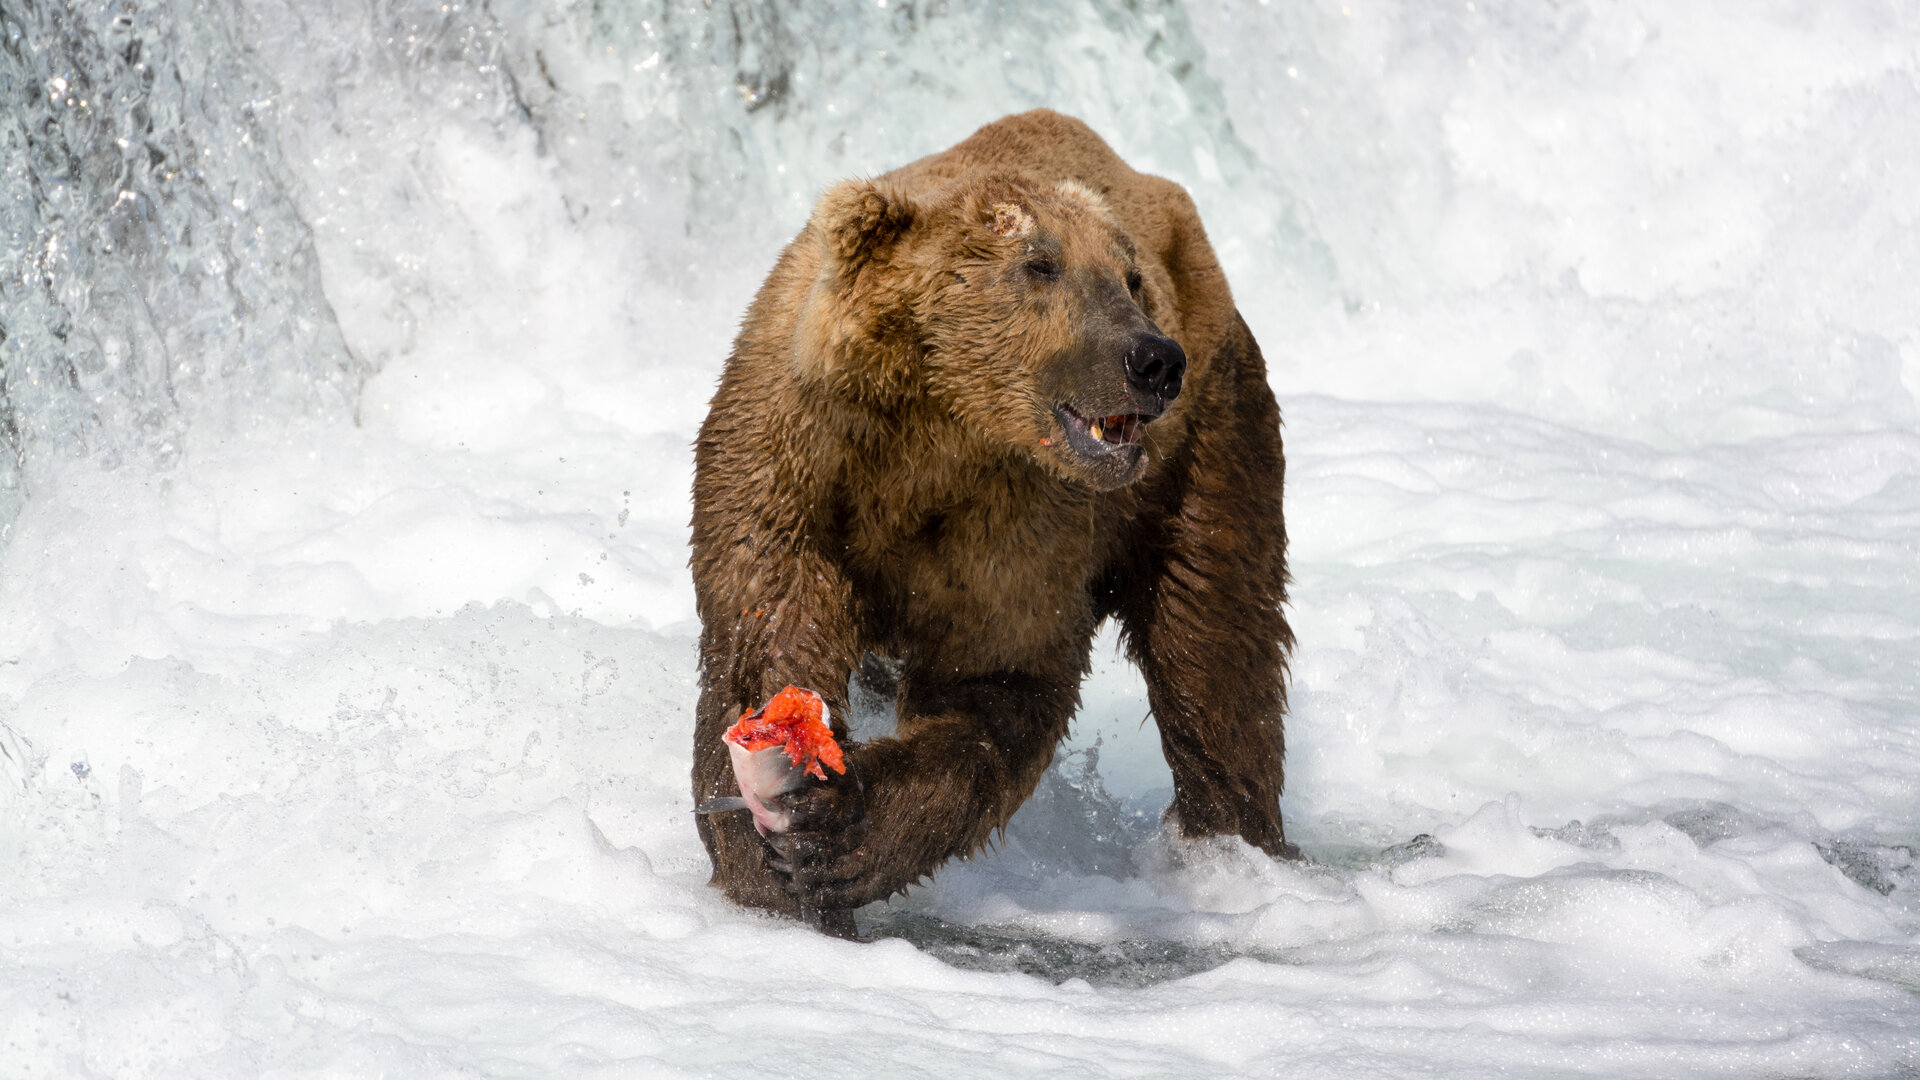
The bear is half made of salmon. The mass spec can prove it. Marine carbon has a different ¹³C signature than terrestrial carbon. So does grassland (C4) carbon versus forest (C3) carbon. Whatever a body is built of, its δ¹³C remembers. Snip a hair, run it on the IRMS, and you can tell exactly what mix of foods built this animal — even if you never saw it eat.
The question it answers
Was this body built from the sea — or from the land?
An animal that could be eating either marine food or terrestrial food sits between two known carbon sources. Plankton, fish, and marine plants have δ¹³C around –19 to –22 per mille. Land plants — most of them — sit around –25 to –28. The two carbon worlds are chemically distinct.
Sample a body that ate both. Its δ¹³C lands between the two sources, weighted by what it ate the most of. The math is simple: where it sits between –19 and –26 tells you how much of it came from the sea.
δ¹³C · three steps
The method.
Collect tissue
Hair, bone, feather, ivory, baleen, tree ring. Tissues that grow continuously are best — they record diet across time, like a tape recorder. A single hair can carry months of feeding history along its length.
Run δ¹³C on the IRMS
Same instrument as δ¹⁵N. Same combustion. Different gas counted — carbon dioxide instead of nitrogen. The number comes out in parts per thousand again. Smaller (more negative) means lighter carbon — usually terrestrial.
Compare to source mixture
You need to know the δ¹³C of the possible food sources. Plug your measurement into a simple mixing formula. Out comes a percentage: how much of this body was built from each source.
The math is a story
An example.
Marine carbon at –19. Terrestrial carbon at –26. The bear's hair reads –22 — almost exactly halfway between. About half of this bear was built from salmon. The rest came from berries, roots, and other land plants. The bear never told us, and we never watched it eat. The hair did the telling.
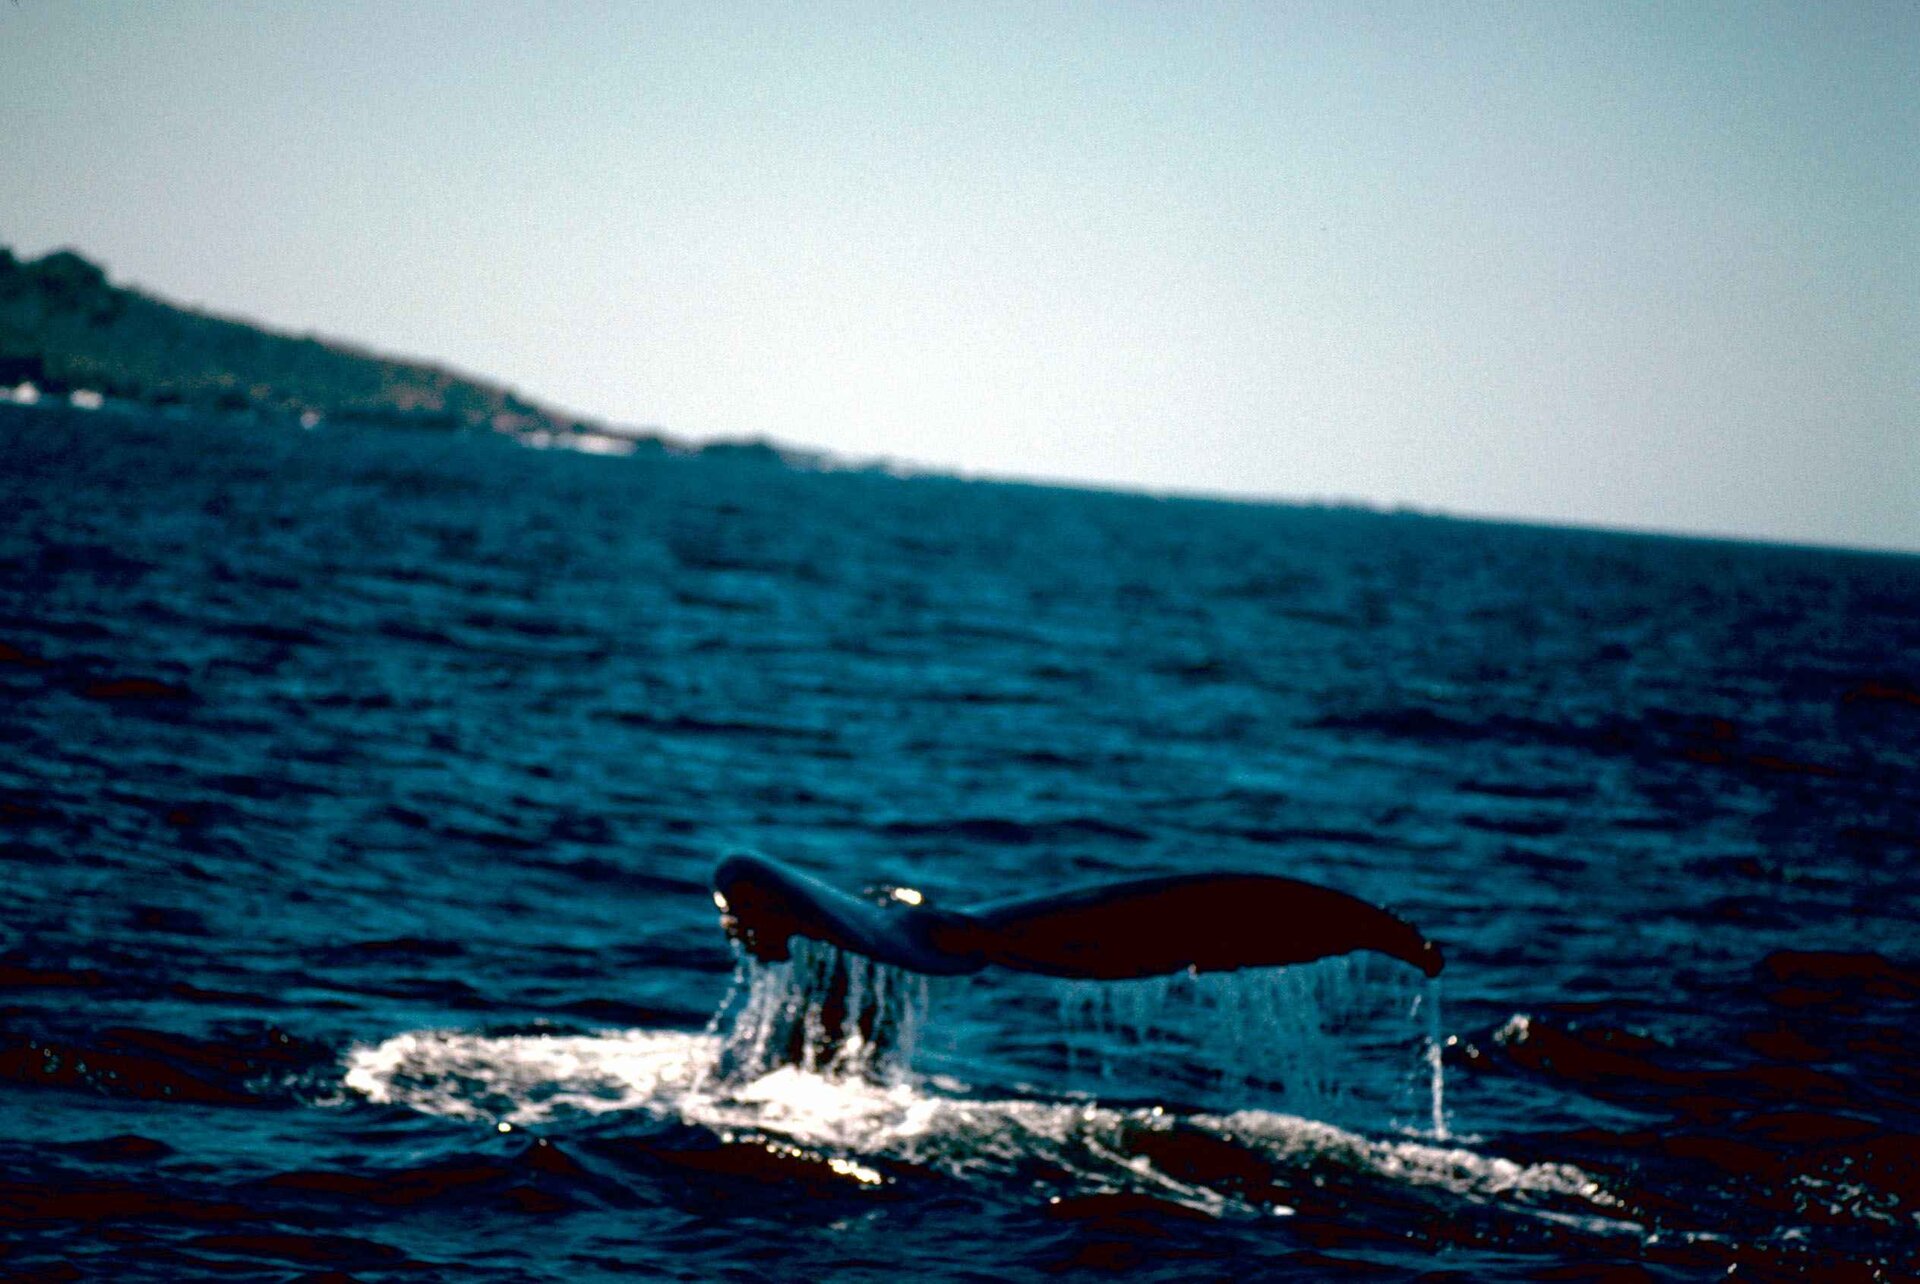
The baleen is a calendar. The whales told us when they moved. Baleen plates grow continuously across years. Slice one length-wise, sample δ¹³C and δ¹⁵N every centimeter, and you have a month-by-month diary of where the whale fed. North Atlantic right whales — the same species that pass through Cape Cod Bay every spring — historically summered in the Bay of Fundy. Around 2010 they shifted to the Gulf of St. Lawrence. Scientists confirmed the move by reading the isotope record locked in baleen from whales that died before and after the shift. The whales had moved on. The atoms in their plates said when.
Where else this works
δ¹³C is everywhere now.
Gulf of Maine · museums & modern
Cod diets across a century
Atlantic cod bones from museum drawers and archaeological middens in Penobscot Bay carry δ¹³C from centuries ago. Modern cod sampled at the same sites read lighter — partly because cod diets have shifted, partly because the atmosphere itself has changed (see next card). The fish remember what the Gulf used to look like.
Africa · 1990s—today
Tracing illegal ivory
Forest elephants eat C3 plants — leaves, fruit — with δ¹³C around –25. Savanna elephants graze C4 grasses with δ¹³C closer to –13. The carbon in a confiscated tusk pinpoints which kind of habitat the elephant lived in, narrowing down where it was poached. Used together with DNA, it builds a map of the trade routes.
Worldwide · 1850—today
Fossil fuels in tree rings
Coal and oil are δ¹³C-light. Burning them lightens the atmosphere itself — a global signal called the Suess effect. Atmospheric δ¹³C has dropped about two per mille since 1850. The decline is recorded, year by year, in tree rings everywhere on Earth. Every tree is a fossil-fuel meter now.
Two atoms · one body
What you walk away knowing.
δ¹⁵N (nitrogen-15)
Asking a body where it sits in the food web. Nitrogen gets heavier by about 3‰ each step up. Also flags origin — ocean nitrogen is heavier than land nitrogen, so a body fed by the sea looks different from one fed by the soil.
δ¹³C (carbon-13)
Asking a body what it ate. Marine carbon and land carbon have distinct signatures. So do C3 forest plants and C4 grassland plants. A single tissue value plus a mixing model says how much of the body came from each source.
Different atoms. Same underlying truth: the atoms are the record. Every meal an organism ate, every habitat it lived in, every breath it took — written down, in heavy and light atoms, in the body itself. You don't have to watch the animal eat. You only have to read what it built itself out of.
Your turn.
Pick an organism you can imagine sampling. Something you've actually seen. Stable isotopes are the tool — your job is to design the question.
A cod from the Gulf of Maine. Hair from a stray cat in your neighborhood. Leaves from a tree near the highway. Your own hair.
Write it down — all four:
- What's your question — about where the nutrients came from, or about what was actually eaten?
- Which isotope — δ¹⁵N, or δ¹³C?
- What tissue would you sample, and from where?
- What would the result tell you — and what would it not tell you?