How We Know · Unit 2 of 4
How We Listen
Letting the organisms tell you what the environment is like.
Lichens · EPT index · Environmental Biology
Quick — guess.
Is the air outside your school clean enough?
Is the water in the Malden River clean enough for a fish to live in? Is the stream behind your grandmother's house healthier this year than last year?
You could buy a sensor. You could send a sample to a lab. Or — you could look at who lives there. The organisms have been there the whole time. They've been telling you the whole time. You just have to know how to listen.
The honest truth
Some species can't live anywhere with bad conditions.
If they're there, the conditions are good. If they're gone, something is wrong. We call them indicator species.
Last week we counted. This week we read what's already there. Two indicator systems — one for air, one for water. Both have been doing this work for over a hundred years.
Two shapes of problem
The air, or the water.
If you want to know about the air
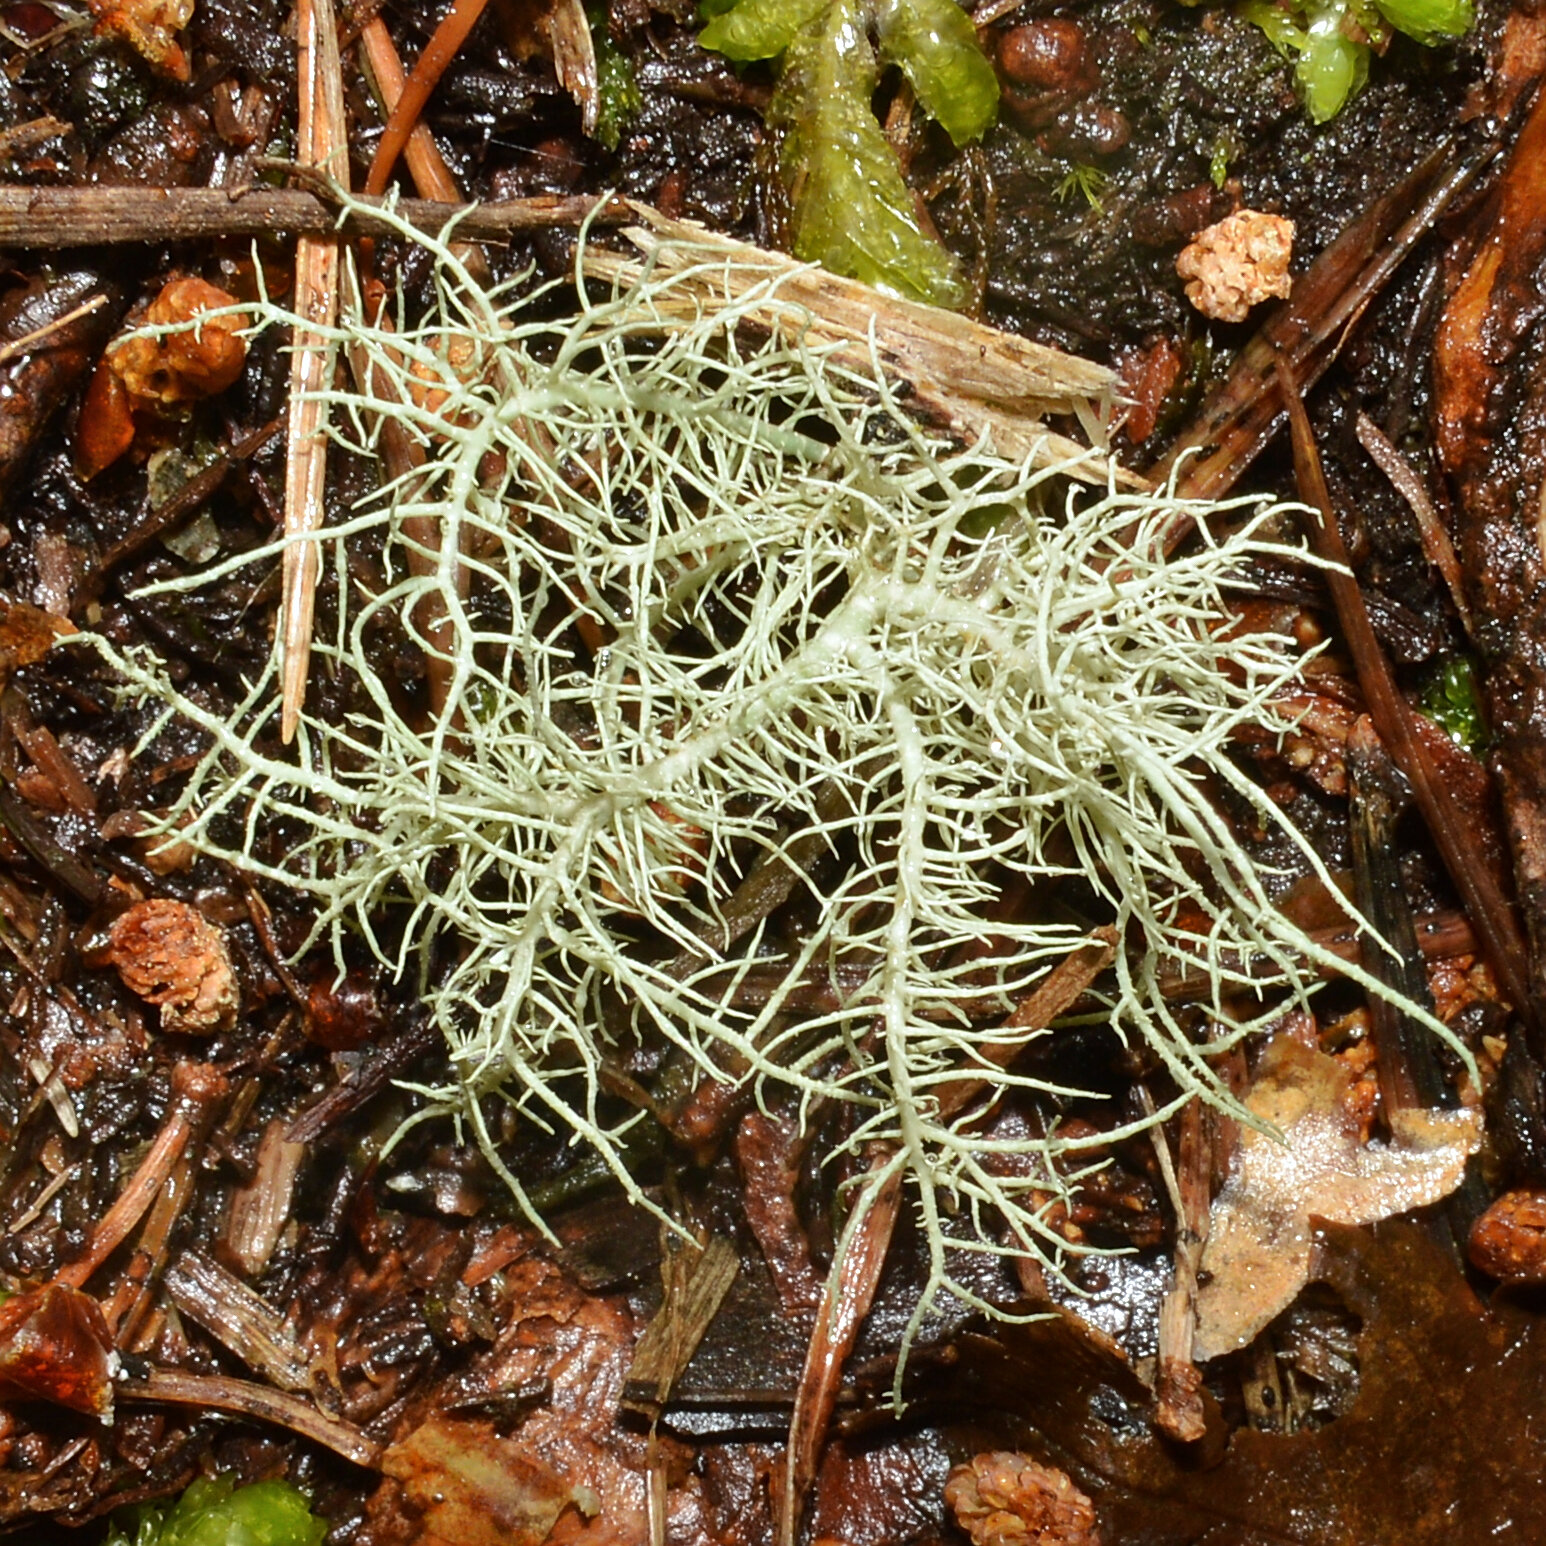
Look at the lichens on a tree.
The species growing — and the ones missing — tell you what's been in the air for years. Lichens grow slowly. They're patient witnesses.
Use: lichen biomonitoring.
If you want to know about the water
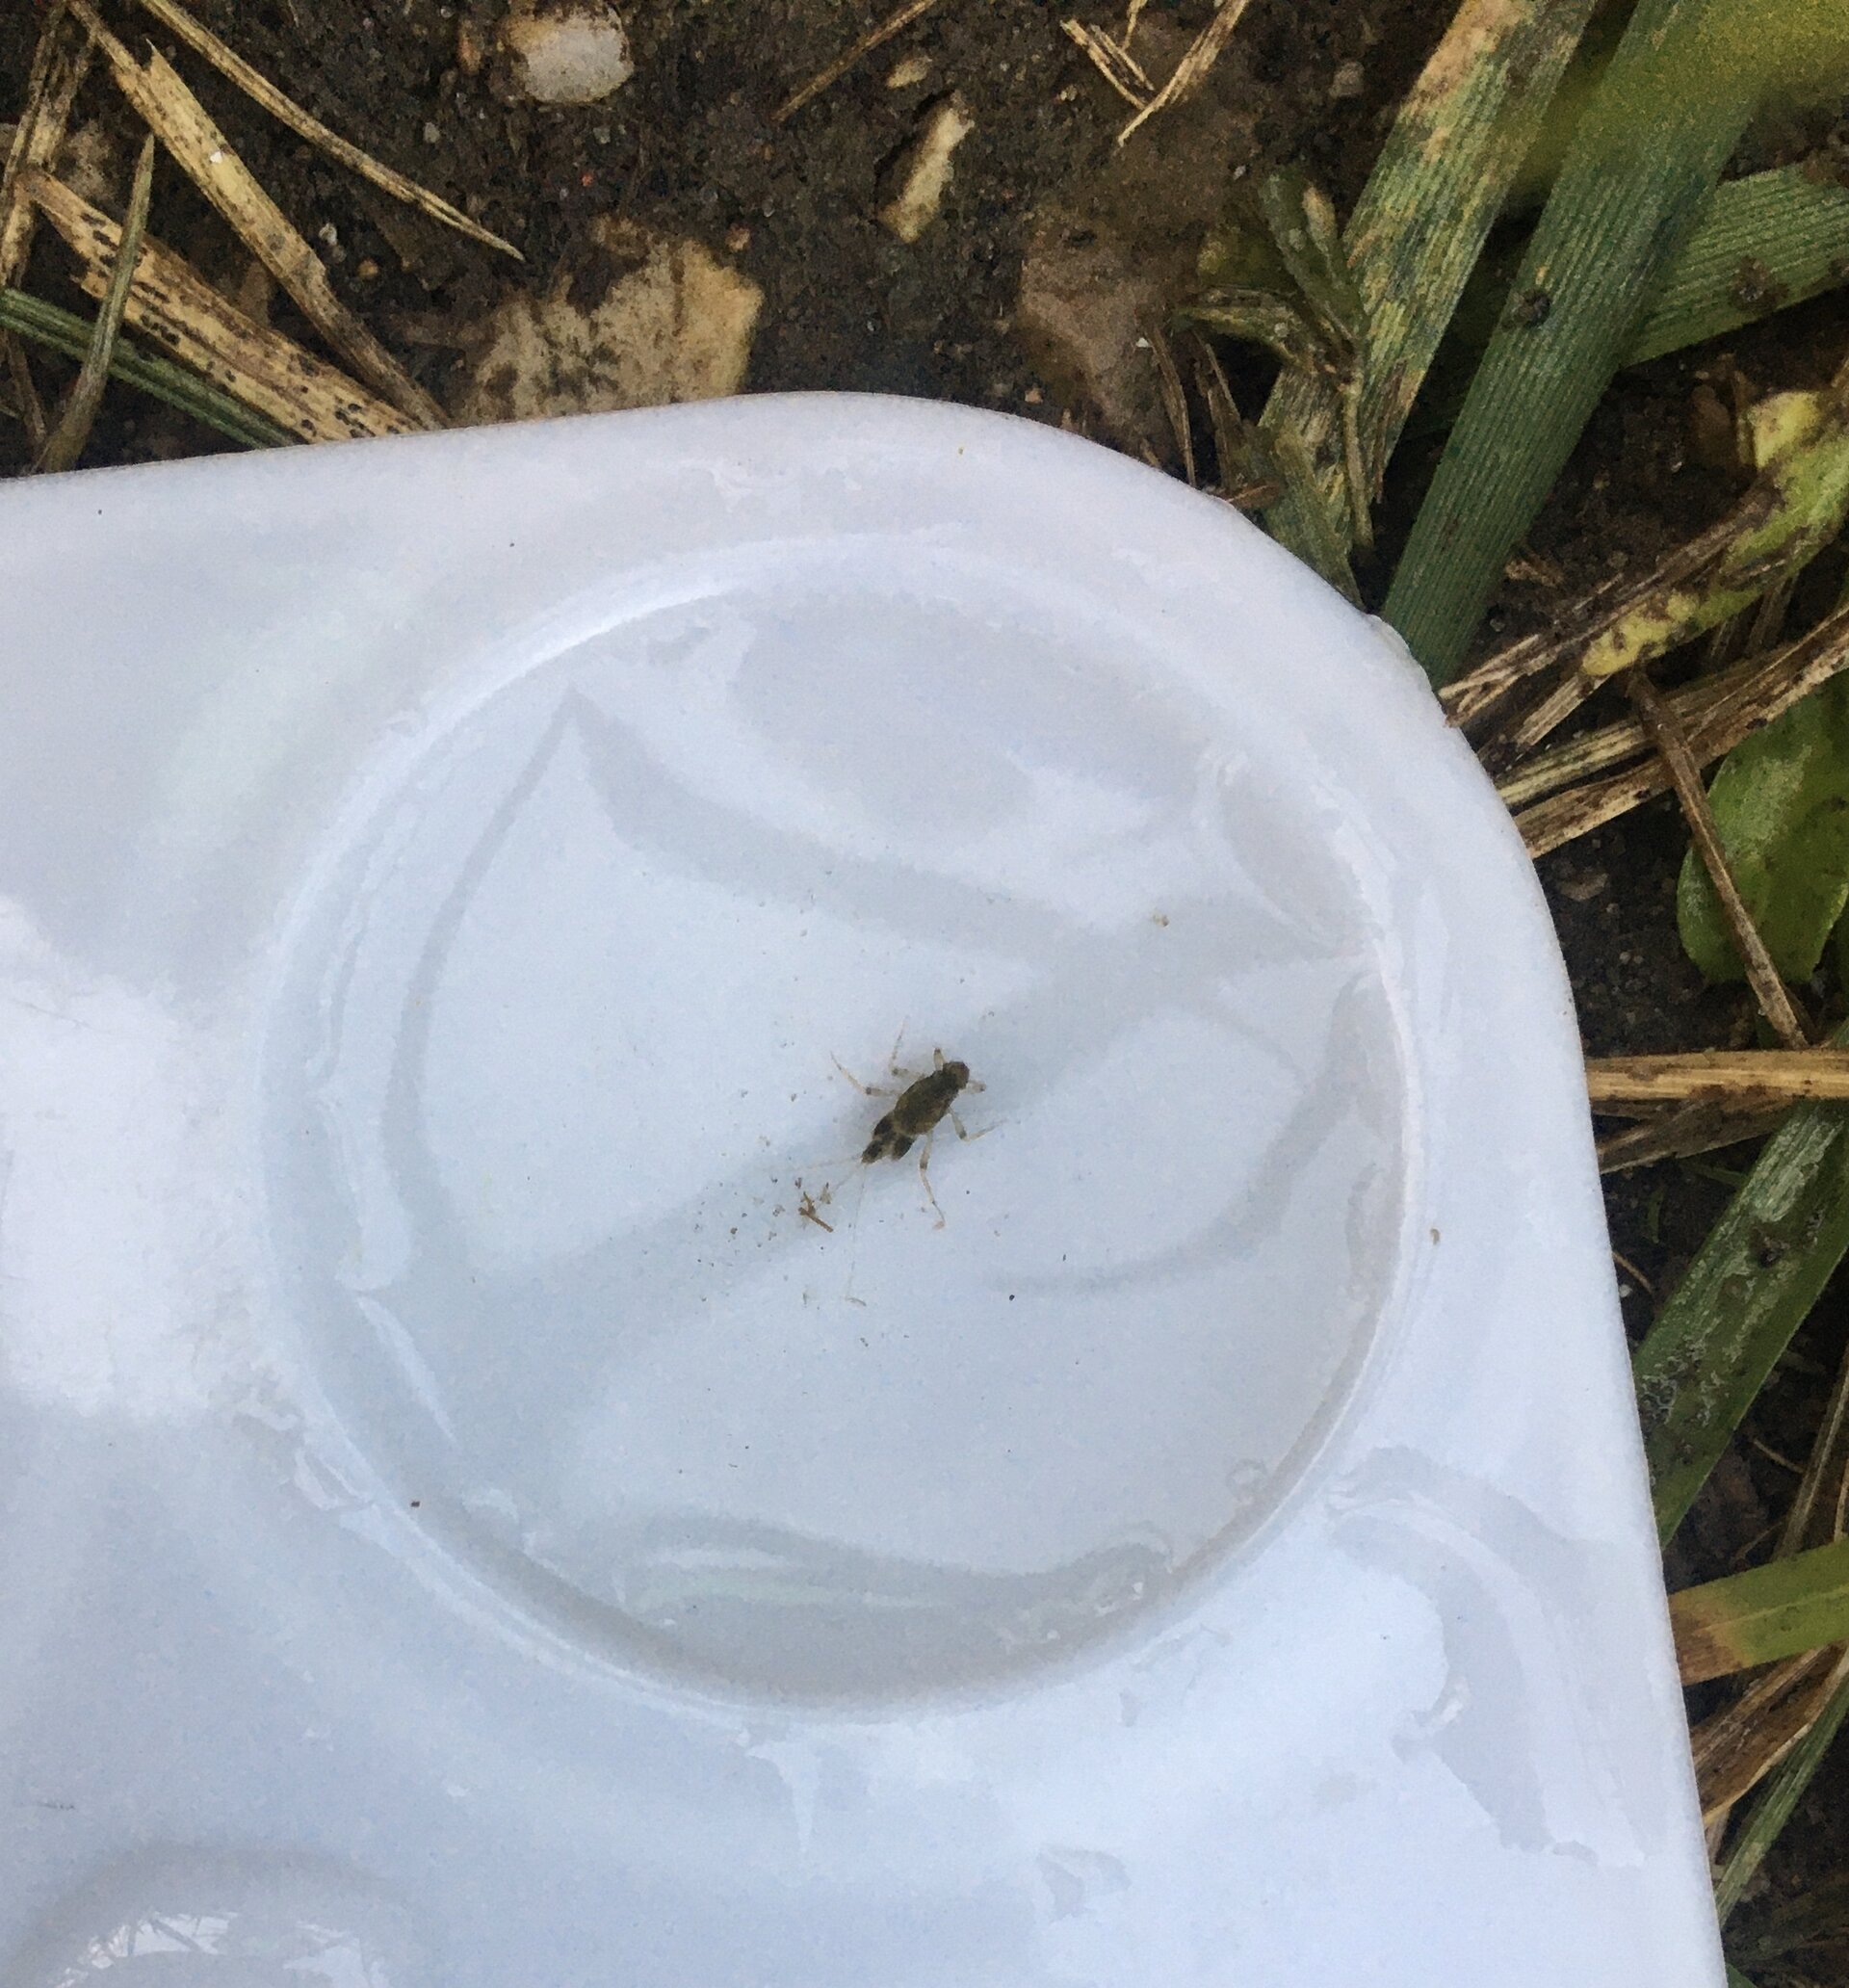
Look at the bugs under the rocks in the stream.
The mix of insects tells you how clean the water has been for months. Pollution-sensitive species disappear first.
Use: EPT index.
Beard lichen. It only grows where the air is clean. Usnea. Hangs from trees in unpolluted forests. Disappears within years when sulfur dioxide or excess nitrogen show up in the air. If it's there, your air has been clean for a while. If it's gone — start asking why.
The question they answer
What's the air actually been like?
A sensor tells you what the air is doing right now. A lichen tells you what the air has been doing for the last ten years. They grow millimeters per year. Their tissue records the chemistry around them.
And different species respond to different things. Some die in sulfur. Some thrive on nitrogen. The mix of who's there is a fingerprint.
Lichen biomonitoring · three steps
The method.
Find a tree
Same kind of tree at every site — oak, maple, pine. Bark texture matters; different lichens like different bark. Use the same height and same side of the trunk every time.
Identify and count
Identify each lichen species. Note which are pollution-sensitive (like Usnea) and which are pollution-tolerant (like the bright orange Xanthoria). Count or estimate cover.
Score the site
More sensitive species means cleaner air. More tolerant species means polluted air. Compare sites. Compare years. The score is your answer.
The math is a story
An example.
A positive score means the sensitive species are winning — the air has been clean. A negative score means the tolerant species have taken over — something has been off in the air. Same logic as a vote count: who's there, who isn't, and by how much.
London. The lichens almost vanished. Then they came back. By 1850, coal-burning London had so much sulfur dioxide that nearly every sensitive lichen species was gone from the city. The bare-bark "lichen desert" stretched for miles. After the 1956 Clean Air Act, SO₂ dropped sharply. By the 1980s, sensitive lichens were returning. But the new arrivals — bright orange Xanthoria, like this one — are nitrogen-loving. They're telling us about a new pollutant: nitrogen oxides from car exhaust and ammonia from farms. The lichens kept witnessing. The story changed.
Where else this works
Lichens are listening everywhere.
US National Forests · 1994—today
Forest Service air quality network
The USDA Forest Service tracks lichens at hundreds of forest plots from Alaska to Florida. Lichen tissue is also chemically analyzed — heavy metals, sulfur, nitrogen — to pinpoint pollution sources. National parks use the data to set air quality goals upwind.
Europe · 2014—today
EN 16413 standard
A common European protocol for lichen biomonitoring. Used across 15 countries on 9,000+ trees. Recently mapped ammonia drift from livestock farms across the Netherlands. Same method, working at continental scale.
Antarctica · ongoing
Climate change in slow motion
Lichens are some of the only multicellular life on the rocky Antarctic continent. They live for hundreds of years. Researchers are watching them respond to warming — different species moving uphill, others arriving for the first time. A continent-sized thermometer made of lichen.
What it can't tell you · limits
Three things lichens can't do.
1. They're slow. A new pollution problem takes years to show up in the lichen community. If a factory started emitting yesterday, the lichens won't know yet.
2. They can't tell you the source. "There's nitrogen in your air" is the answer. Whether it's a farm two miles away or traffic on the highway is a separate question.
3. They can't recover instantly. Even after the air gets clean, it can take decades for sensitive species to colonize again. Some never come back.
Method two
What about water?
Find a creek. Flip a rock. Look at what's underneath.
Mayflies. They drown in dirty water. They breathe through delicate gills on their bellies. Their gills clog with sediment, choke on low oxygen, fail in warm water. If a stream has mayflies, the water has been clean — really clean — for months. If it doesn't, something is wrong.
The question they answer
What's the water actually been like?
You can test water chemistry on Tuesday and miss the runoff that happened Monday. The fish swim away. The chemistry returns to normal. The mayflies, though, were there. They died. And they aren't there now.
EPT — short for Ephemeroptera, Plecoptera, and Trichoptera: mayflies, stoneflies, and caddisflies. All three are pollution-sensitive. Count how many kinds you find. That's your score.
EPT sampling · three steps
The method.
Kick a riffle
Stand upstream of a riffle — fast water over rocks. Hold a net downstream. Scuff your foot on the bottom for three minutes. The insects come loose and float into the net.
Sort and identify
Dump the net into a tray. Pick out everything that's moving. Identify each one — mayfly, stonefly, caddisfly, midge, worm, snail. Many guides exist; the families are learnable in an afternoon.
Score the stream
Count how many different mayfly, stonefly, and caddisfly families you found. Add them up. High EPT richness means clean water. Low EPT richness — especially with no stoneflies — means trouble.
The math is a story
An example.
9 EPT taxa = excellent water quality. Compare to a parking-lot drainage ditch that scores 0 — no mayflies, no stoneflies, no caddisflies. Just worms and midges, the species that survive anything. The difference between the two streams is in what's not there.
After 1972, the EPT count went up. Before the Clean Water Act, rivers across the US ran so foul that some caught fire. The Cuyahoga in Ohio burned in 1969. The Charles River, right here in Boston, was famous for being filthy. After the Act passed, sewage and industrial discharges were regulated. The EPA wrote a standardized EPT-based bioassessment protocol in the 1980s. MassDEP uses it today on streams in our own watersheds. The recovery isn't even — some streams came back fast, some are still struggling. But the EPT counts make the change measurable in a way pictures never could.
Where else this reveals change
Macroinvertebrates listen everywhere.
Mystic watershed · MassDEP 2009
Local stream monitoring
The Massachusetts Department of Environmental Protection sampled benthic macroinvertebrates across the Mystic, Neponset, and Weymouth/Weir watersheds in 2009 (Technical Memo CN 341.3). The same insects we just talked about — mayflies, stoneflies, caddisflies — were the score sheet. Used to set cleanup priorities.
Appalachia · 1980s—today
Acid mine drainage
Streams downstream of abandoned coal mines turn orange and lose all their EPT. As mines are sealed and treatment ponds installed, biologists watch for mayflies returning. The bugs are how you know the cleanup is working — chemistry alone can't tell you the stream is alive again.
UK · 1976—today
BMWP scoring system
The Biological Monitoring Working Party score, developed in the UK, is the oldest standardized macroinvertebrate index. Every family of stream insect has a tolerance score from 1 (tolerant) to 10 (mayflies & stoneflies — most sensitive). Adapted into dozens of national systems worldwide.
Two indicators · one logic
What you walk away knowing.
Lichen biomonitoring
Listening to the air through the lichens that grow on trees. Sensitive species disappear in polluted air; tolerant species take over. The pattern is a long-term record.
EPT index
Listening to a stream through the mayflies, stoneflies, and caddisflies living under its rocks. They're sensitive to pollution; their richness scores water quality from the past few months.
Different environments. Same idea: some species can't tolerate problems. Their presence — or absence — is a measurement. The organisms are the instrument.
Your turn.
Pick a place you can think of right now — a stream, a park, a tree on your street, the air outside your window.
The Malden River. The Mystic. The trees on Broadway. The cracked sidewalk lichens by the school. The puddle behind the gas station that fills with mosquitoes every summer.
Write it down — all four:
- What environment are you investigating — air, or water?
- Which indicator would you use — lichens, or EPT macroinvertebrates?
- What would you find there if the environment is healthy? What if it isn't?
- Name one thing the indicator can't tell you.