How We Know · Unit 1 of 4
How We Count
Estimating populations you cannot count one by one.
Mark-recapture · Quadrat sampling · Environmental Biology
Quick — guess.
How many wolves are in Yellowstone?
How many lichens on a single tree? How many salmon return to the Mystic River each spring?
You can't count them. Nobody can count them. Most of what we know about populations in nature isn't from counting — it's from estimating well. So how do we know?
The honest truth
Scientists almost never count everything.
They sample carefully. Then they scale up honestly. The math is simple. The discipline is in the sampling.
Two methods do most of the work in environmental biology. One for things that move. One for things that don't. Today we learn both.
Two shapes of problem
It moves, or it stays put.
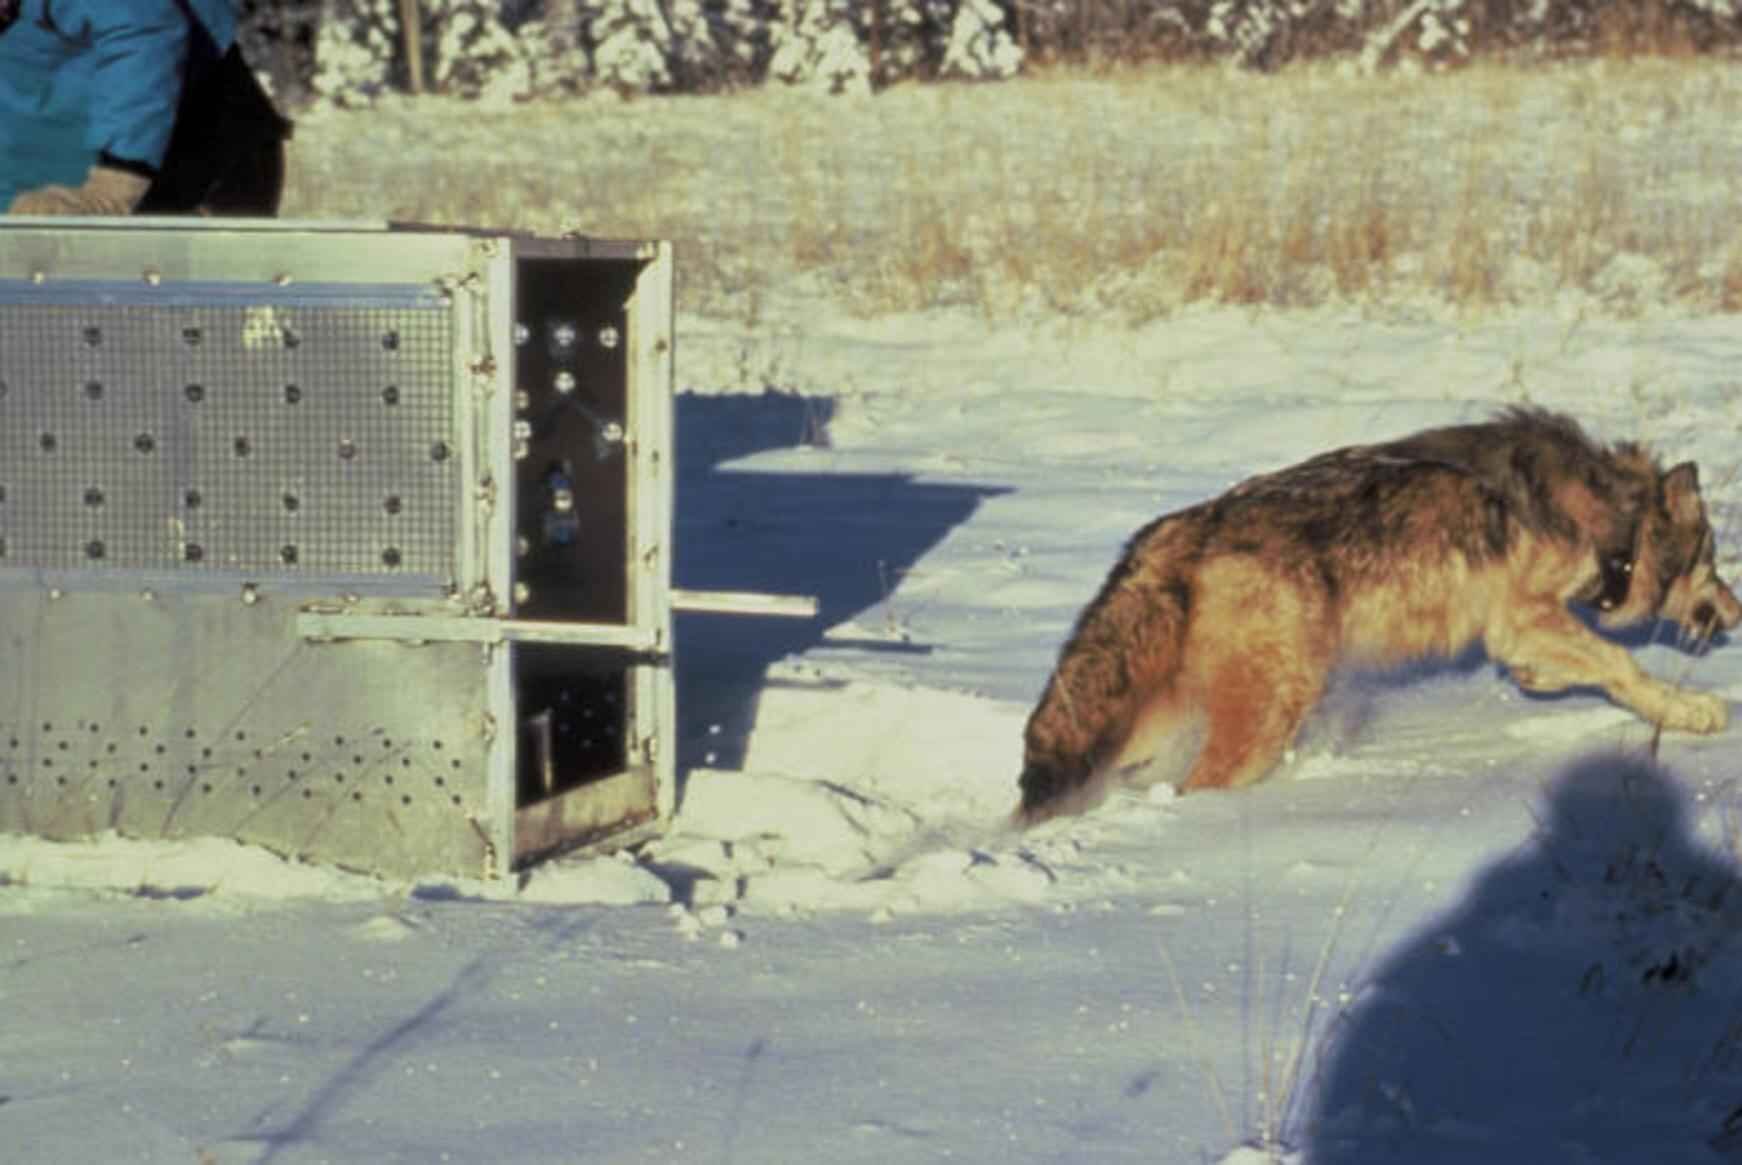
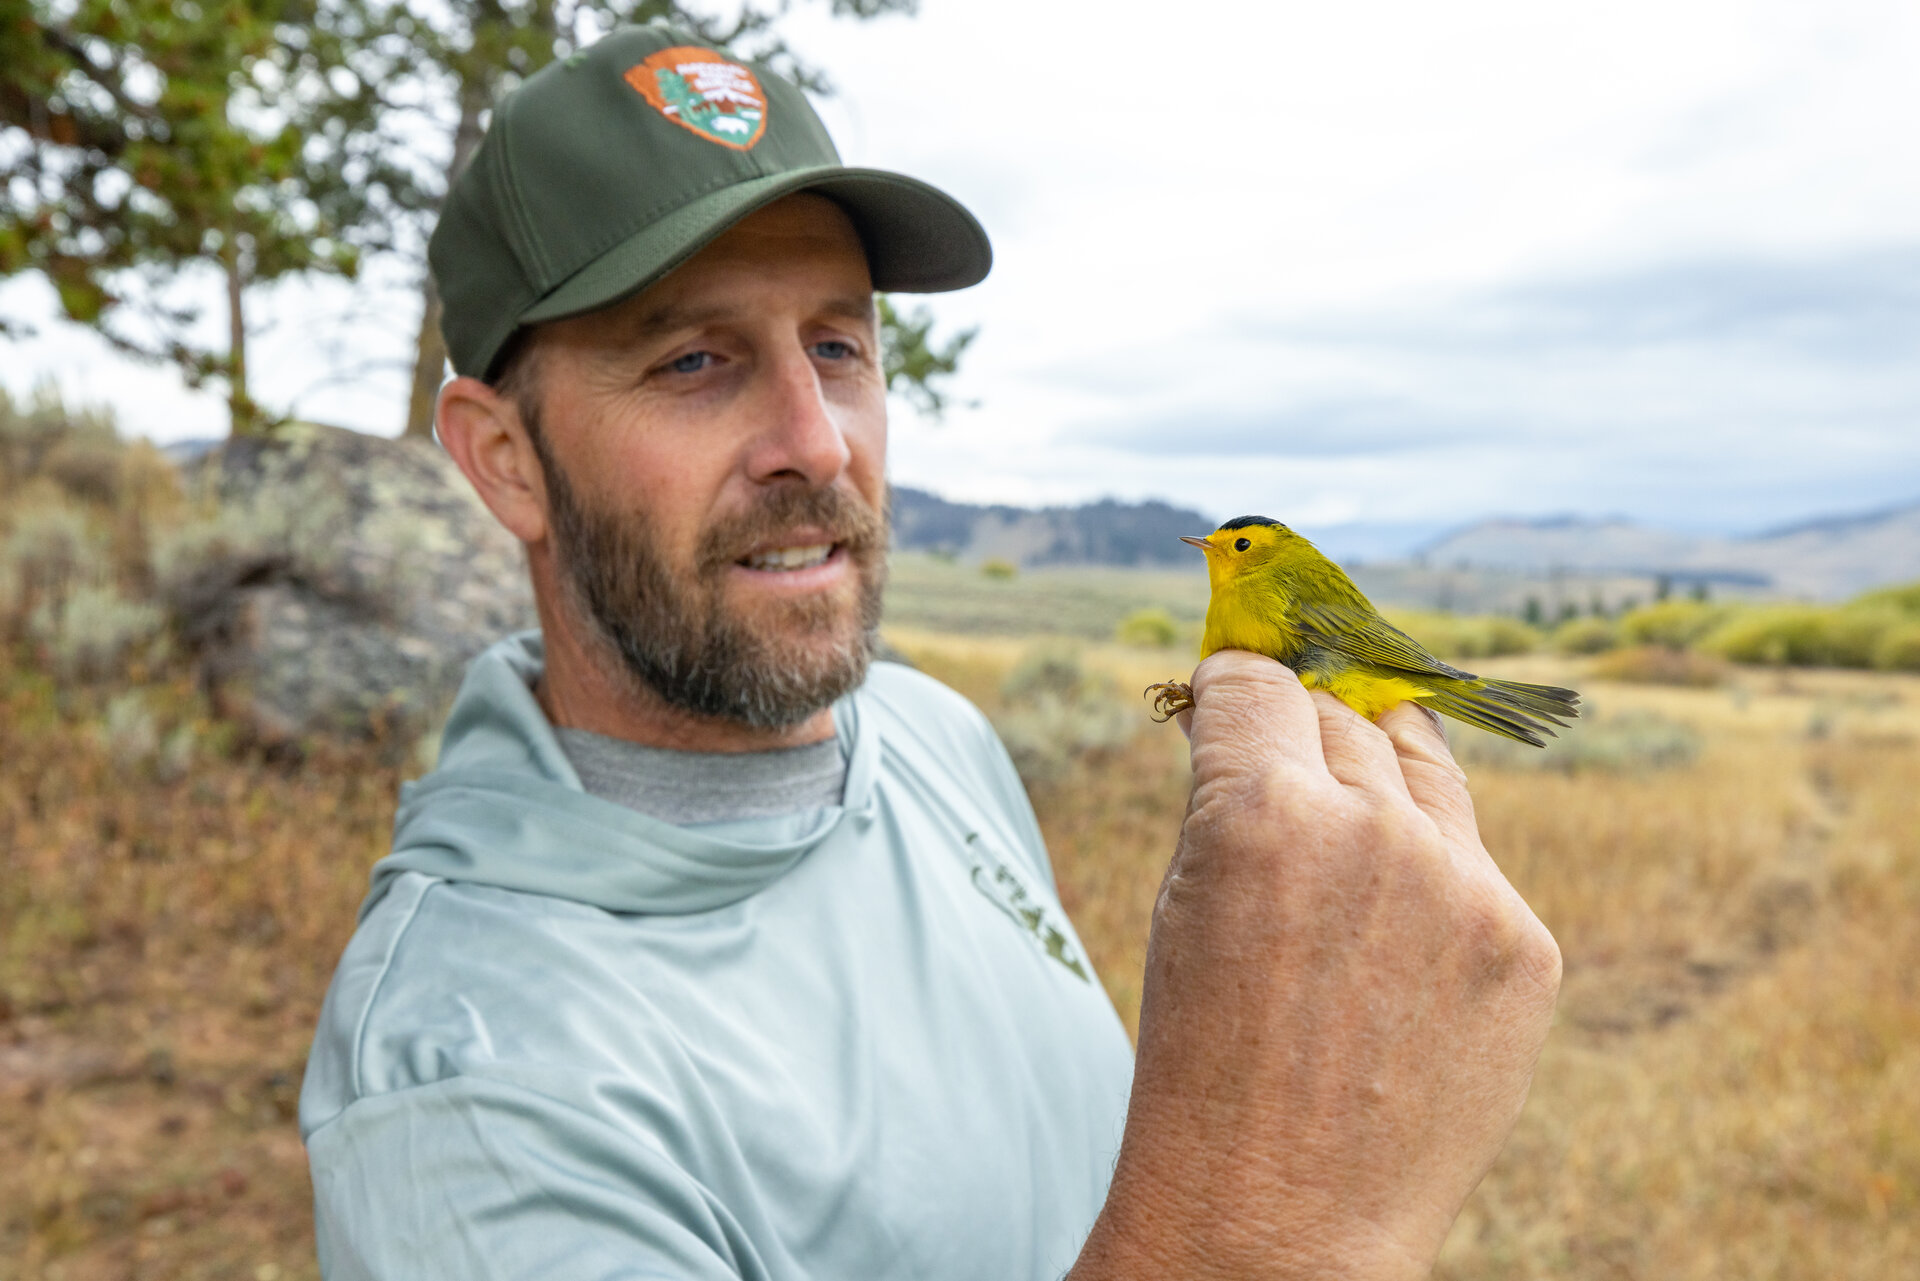
Things that move and hide
Wolves. Fish. Turtles. Songbirds. Insects.
You can't see them all at once. Some are sleeping. Some are underwater. Some are 30 feet up a tree.
Use: mark-recapture.
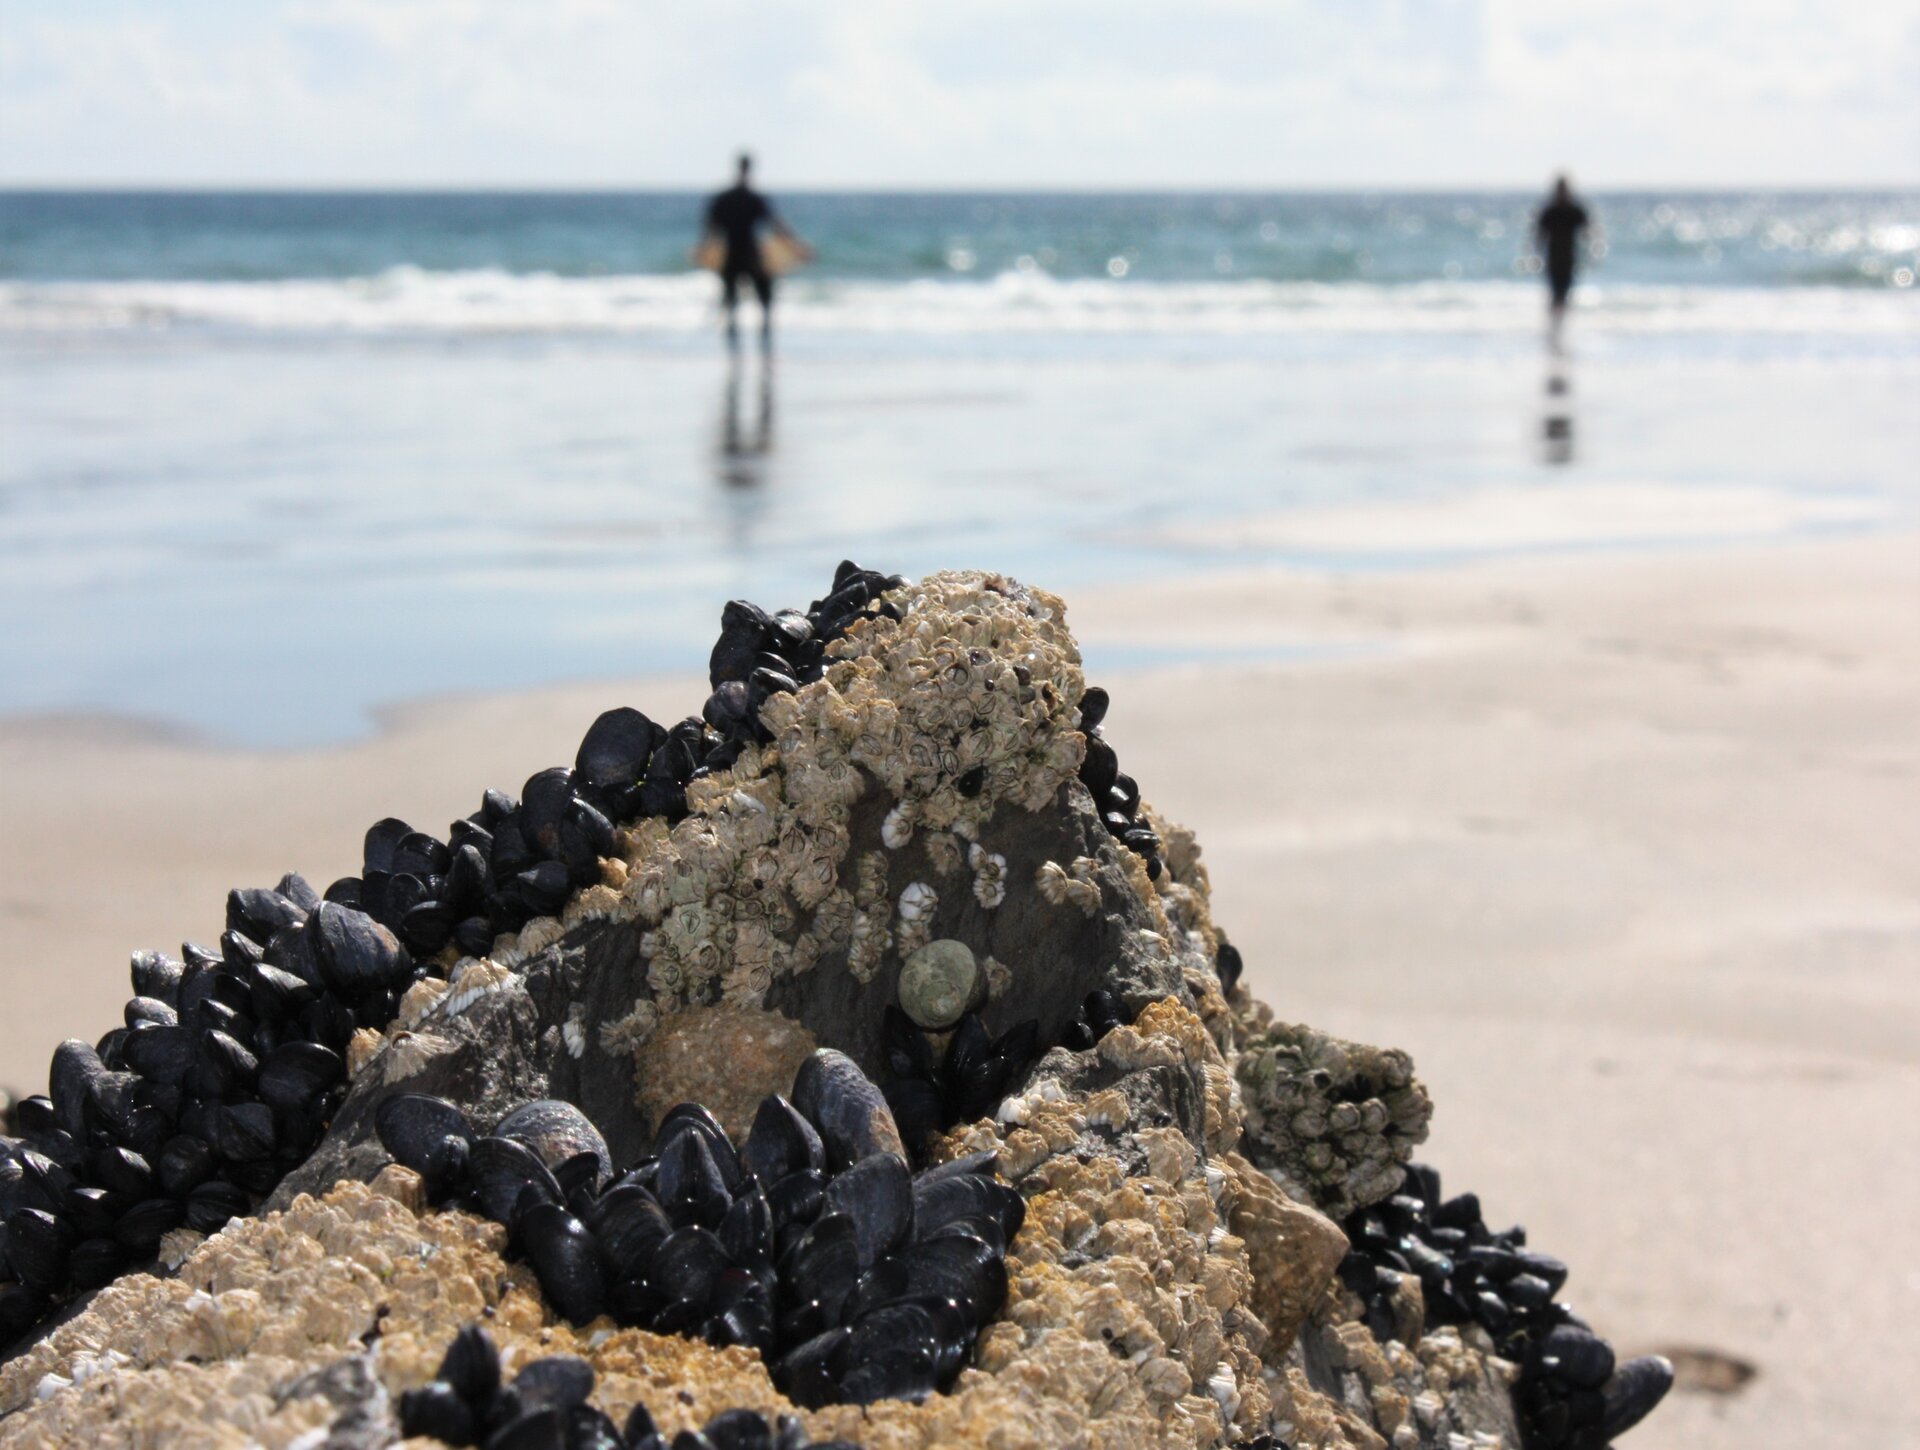
Things that stay put but spread out
Plants. Mussels. Barnacles. Lichens. Corals.
You can see them, but there are too many. Counting every dandelion in a meadow is a waste of a life.
Use: quadrat sampling.
If it moves, mark some of them. Then come back. Catch some more. See how often the marked ones show up again. That ratio tells you the whole population.
The question it answers
How do you count something that hides from you?
You can't see them all. You don't need to.
You need to know what fraction of them you can see. If you've marked some of them, then the fraction of marked animals in your next catch tells you what fraction you've marked of the whole population.
Mark-recapture · three steps
The method.
Capture
Catch some animals. Not all of them. Even a few dozen is enough — as long as you can count what you caught.
Mark and release
Tag them. Band them. Clip a small notch in a fin or a shell. The mark has to last. Then let them go.
Recapture
Wait — days, weeks, sometimes a year. Then catch some more. Count how many are marked. That fraction is your answer.
The math is a story
An example.
Ten percent of the second catch was marked. We marked 100 animals. So 100 must be about ten percent of the population. The population is around 1,000. Same logic as guessing how big a jar of jellybeans is from a handful.
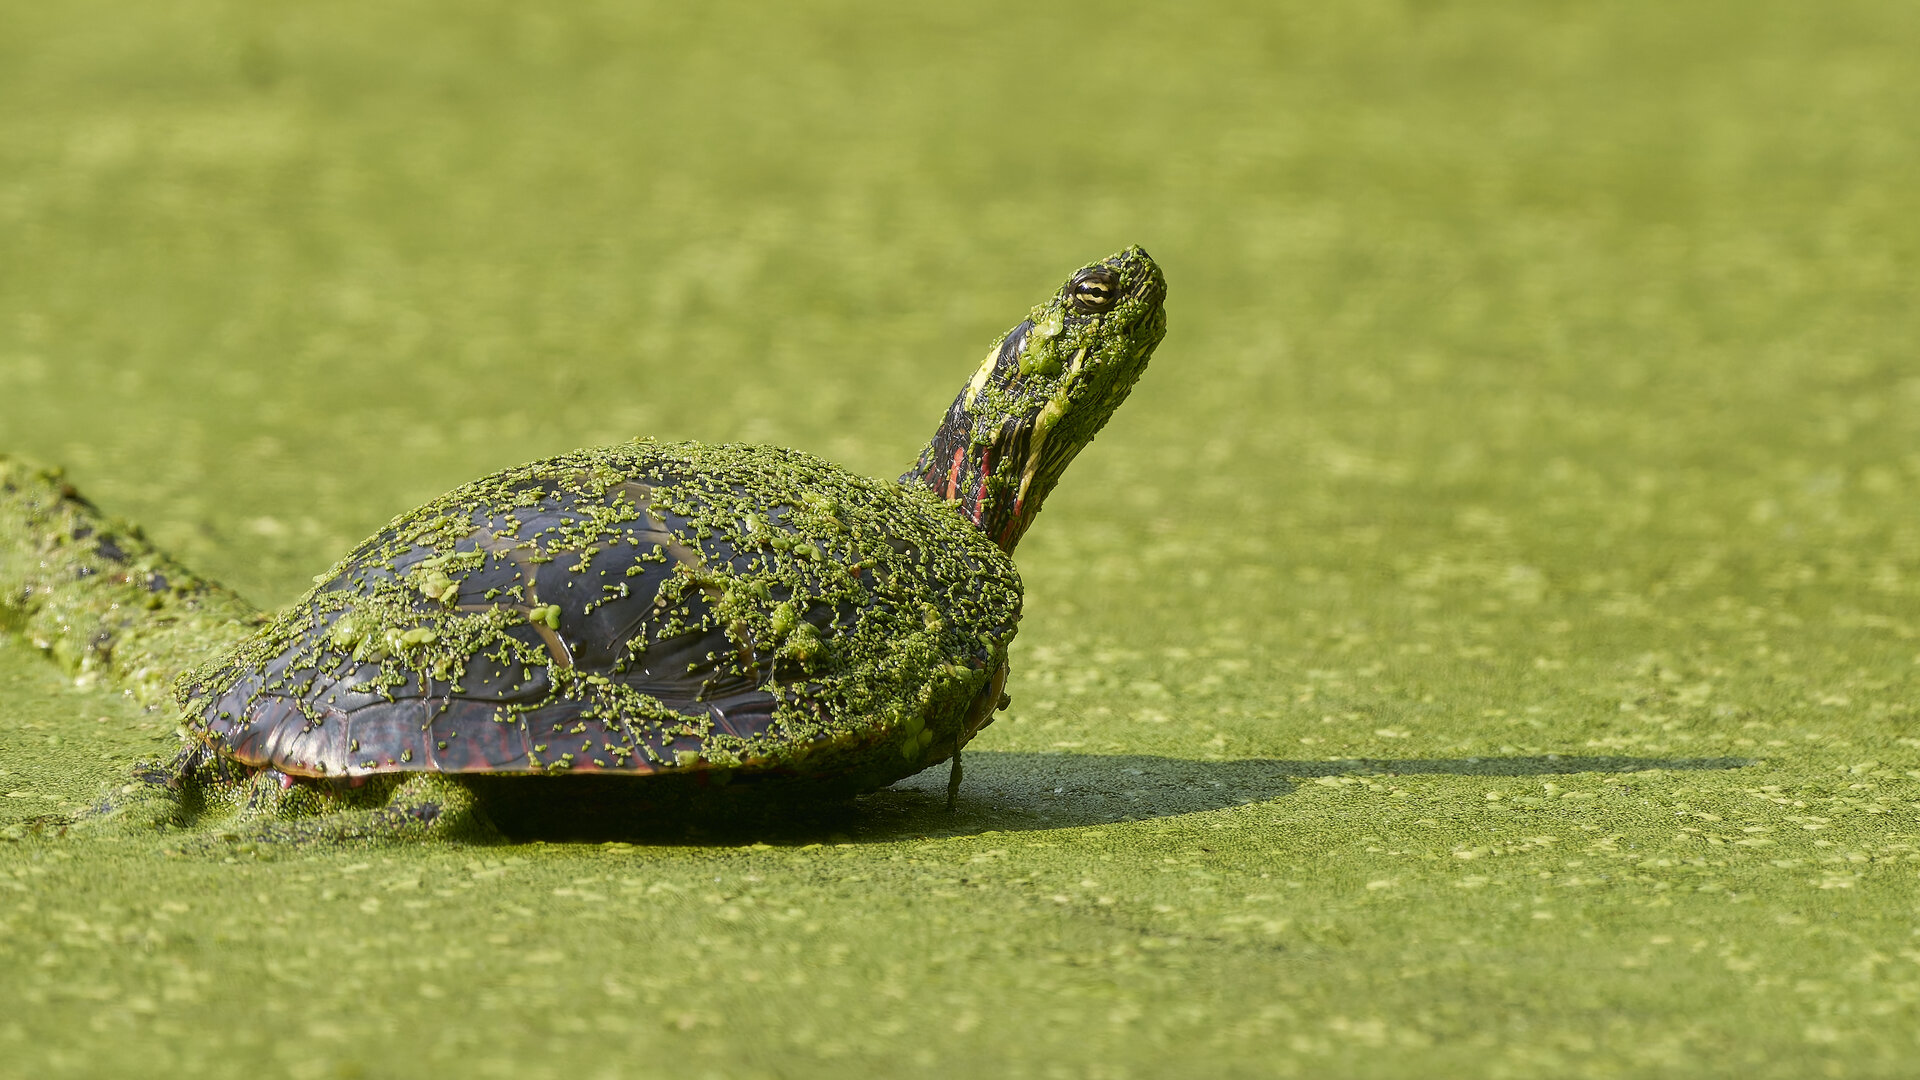
The longest mark-recapture study of turtles ever done. At the E.S. George Reserve in Michigan, biologists Donald Tinkle and Justin Congdon notched the shells of painted turtles in one pond for over thirty years. The data showed turtles live 50+ years — far longer than anyone thought. It showed road mortality near suburbs cuts populations by an order of magnitude. And right now: warmer summers are skewing hatchling sex ratios. None of it would be visible without the patient counting.
Where else this works
Mark-recapture is everywhere.
Delaware Bay · 1990s—today
Horseshoe crabs
Tagged each spring at the spawning beaches. The recaptures showed the population had crashed — too many taken for fishing bait and for biomedical bleeding. The red knots, a shorebird that fuels its 9,000-mile migration on horseshoe crab eggs, crashed with them. New quotas were set from the mark-recapture data. Both are slowly coming back.
Atlantic coast · 1960s—today
Loggerhead sea turtles
Flipper-tagged on nesting beaches since the 1960s. The tag returns showed populations crashing — which drove the 1978 Endangered Species Act listing. Beach-lighting laws, boat-strike rules, and turtle-excluder devices on shrimp boats all came from what the tags revealed.
Massachusetts · 1970s—today
Black bears
Nearly gone from the state by 1900. MassWildlife uses hair corrals — barbed wires that snag a tuft of fur as a bear walks past — for DNA mark-recapture. The data show about 4,500 bears today, growing 8% a year, moving east toward Route 495. That number sets the hunting quotas.
What it can't tell you · failure modes
Three things must be true.
1. The population can't change much between samples. No big births. No big deaths. No mass migration. Otherwise you're counting a different population the second time.
2. Marked animals must mix back in. A marked turtle that hides for a year and never comes back to the pond messes up the count. The marked ones have to be just as likely to be caught as the unmarked ones.
3. The mark can't change the animal. A bright tag that gets a fish eaten by a heron tells you nothing about the population. A band that makes a bird sick is worse.
Method two
What if it doesn't move?
You can't catch a barnacle. You don't need to.
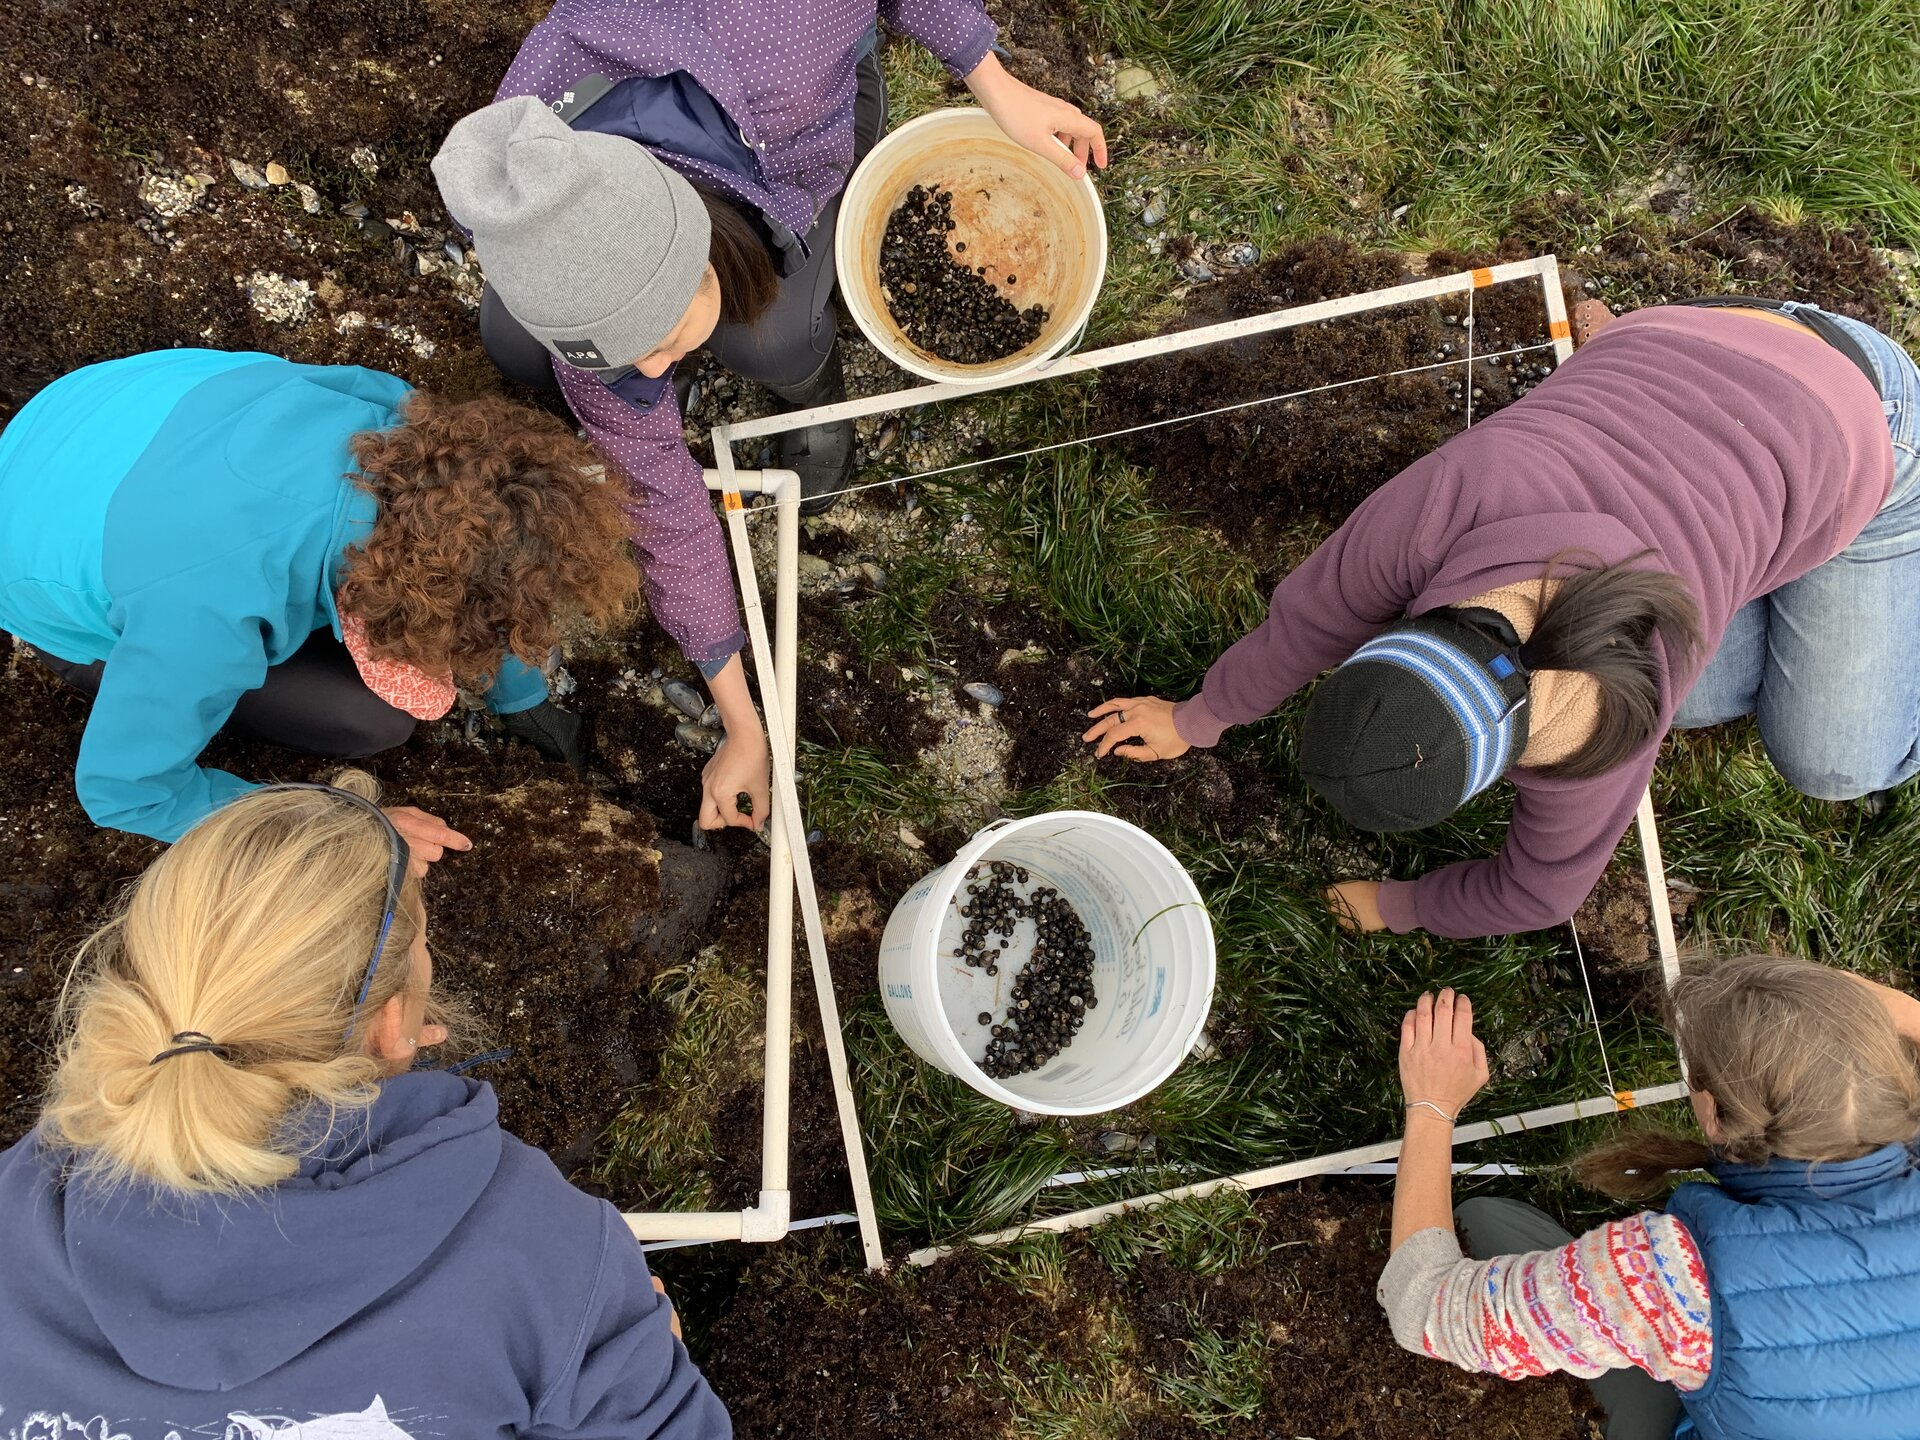
If it stays put, you don't catch it. You frame it. A quadrat is a square — usually 1 meter by 1 meter, sometimes smaller. You drop it down. You count what's inside. You do this many times. Then you scale up.
The question it answers
How do you count things that don't move but cover more ground than you can walk?
Plants. Mussels. Barnacles. Lichens. They sit still. There are millions of them. Counting every one of them would take a lifetime — and you'd be done just in time for them all to be different.
Same answer as before: don't count them all. Count what's in a few small frames. Average. Scale up.
Quadrat sampling · three steps
The method.
Pick random spots
Random matters. If you cherry-pick the best-looking patch, your numbers lie. Some scientists toss the frame over their shoulder. Some use a random number generator.
Frame each spot
A square frame — the quadrat. Often 1 m × 1 m. Smaller for tiny things, like lichen. Bigger for spread-out plants, like trees.
Count and scale up
Count what's inside. Do many quadrats. Take the average. Multiply by the size of the whole area you care about.
The math is a story
An example.
Density × area = total. The same logic that estimates a crowd from a photograph. Same logic that estimates how many trees are in a forest from a satellite image. Density × area, every time.
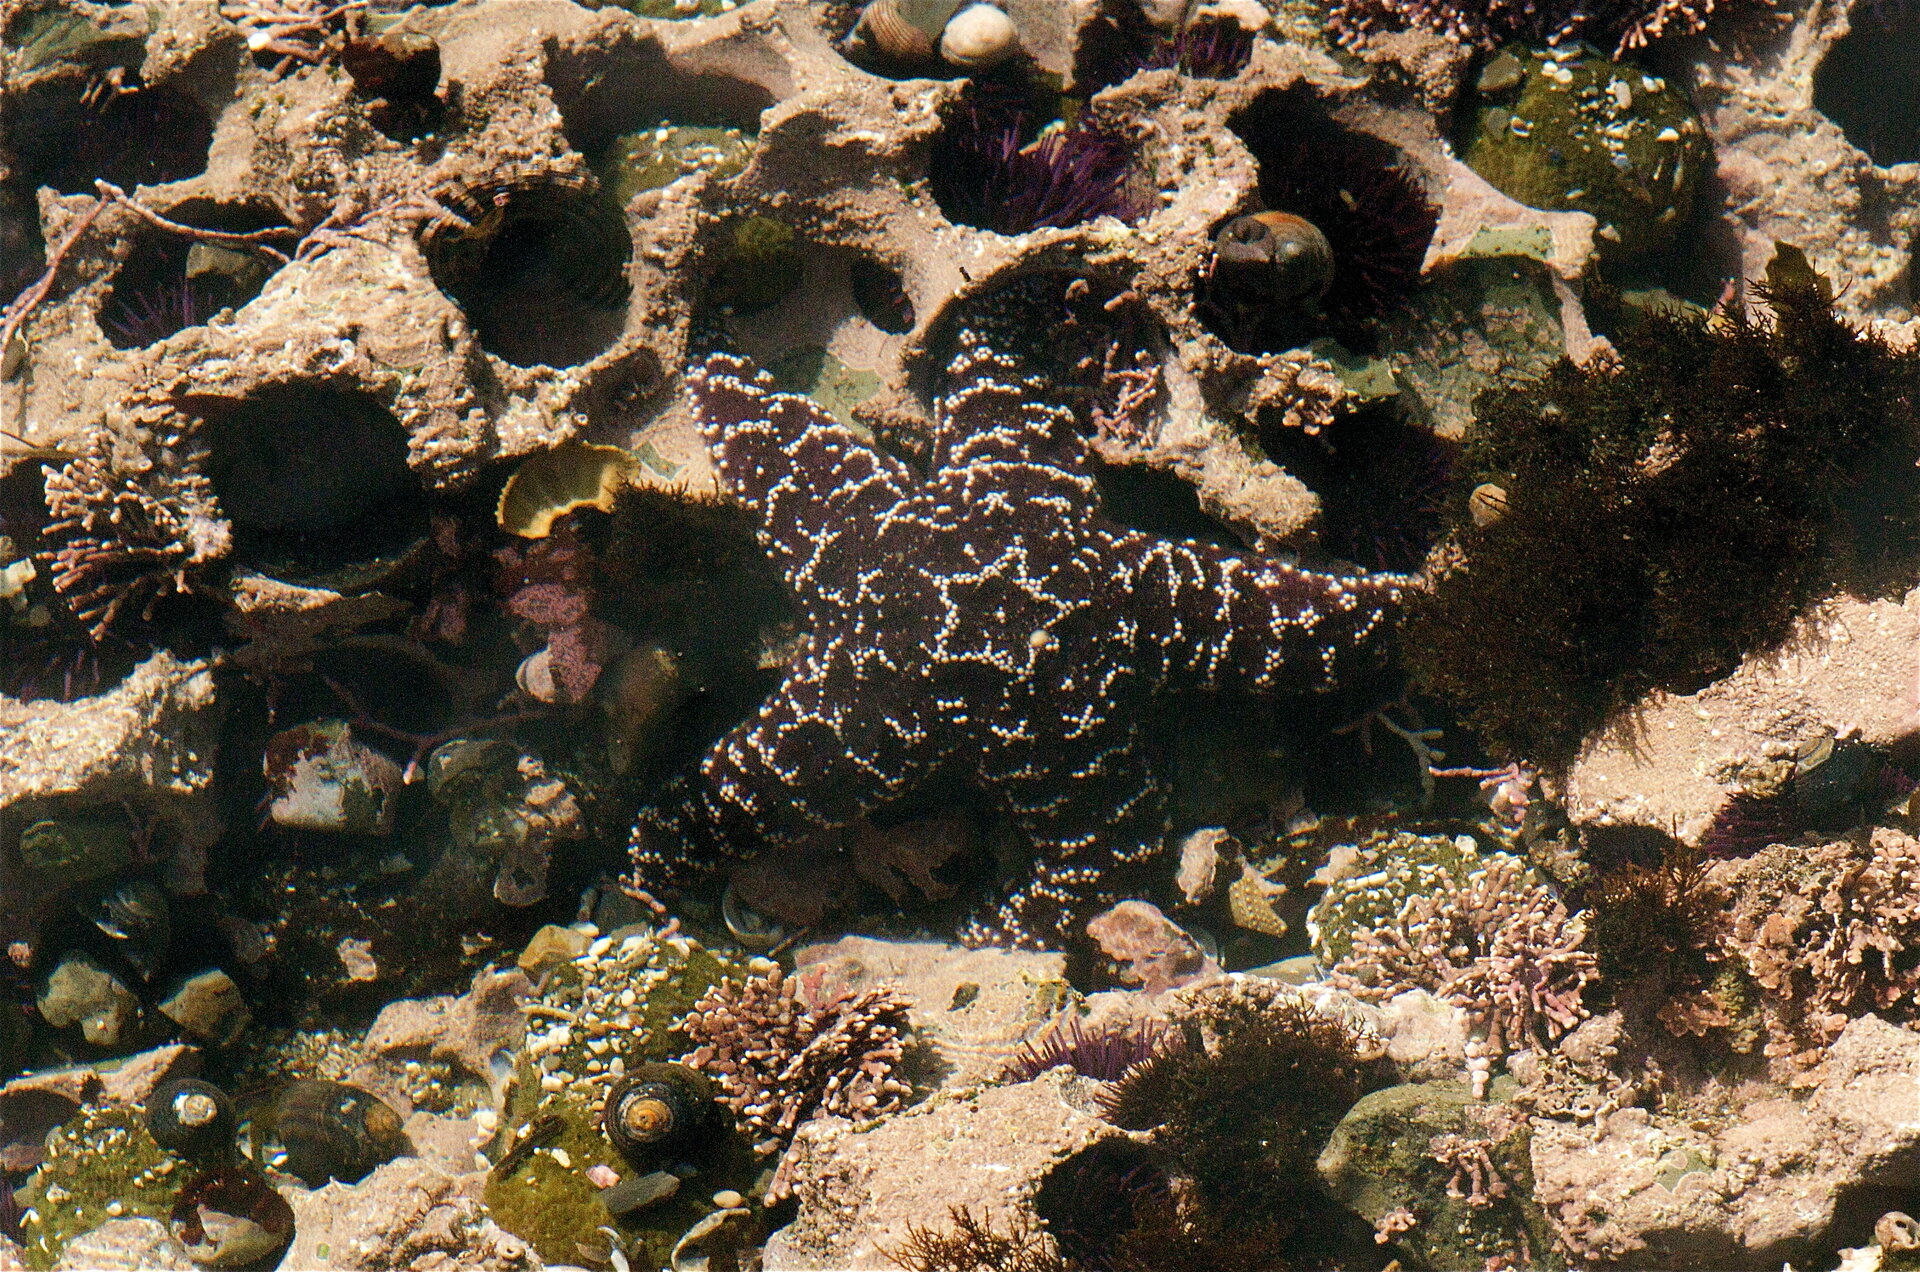
Sea star wasting disease. The quadrats made the catastrophe visible. Remember Pisaster from last week — the keystone of the trophic cascade, the one Paine pulled off the rocks? In June 2013, ochre stars from Alaska to Mexico began dissolving. The MARINe network had been counting sea stars in quadrats here for 20+ years. Without that long-term data, the scale would have been a vague feeling. With it: one of the largest marine die-offs ever recorded, tied to warming ocean water.
Where else this reveals change
Quadrats catch the slow stuff.
Gulf of Maine · 2000s—today
Rockweed
The brown seaweed that defines the New England intertidal — long bushy fronds hanging from every rock at low tide. Hand-harvested for fertilizer and cosmetics; warming oceans are stressing what's left. Long-term quadrat counts in Maine and New Brunswick now drive the harvest quotas.
Massachusetts coast · 2000s—today
Salt-marsh dieback
Spartina — the tall grass that builds salt marshes — has been dying off in patches from Cape Cod to the mouth of the Mystic. Quadrat surveys at sites like Plum Island document the loss. Causes are still debated: maybe crab overgrazing, maybe heat, maybe pathogens. The disagreement is real. The disappearance isn't.
Great Barrier Reef · ongoing
Coral bleaching
Permanent quadrat photo-stations on the reef get re-photographed each year. The 2016 and 2017 mass-bleaching events killed half the corals in the northern third. Without the quadrat baseline, the scale would have been guesswork. With it, the most thoroughly documented coral collapse in history.
Two methods · one logic
What you walk away knowing.
Mark-recapture
A method for estimating populations of mobile organisms. Mark some, release, recapture, use the proportion that's marked to estimate the total.
Quadrat sampling
A method for estimating populations of sessile or slow-moving organisms. Sample small framed areas randomly, count what's in them, scale to the whole area.
Different organisms. Same idea: don't count everything. Sample honestly. Do the math. Almost every population estimate you'll ever read came from one of these — or a close cousin.
Your turn.
Pick something you'd want to count in Everett. Something near you. Something you've actually seen this week.
Roaches in your apartment. Pigeons on Broadway. Lichens on a sidewalk tree. Dandelions in the schoolyard. Crows in the parking lot.
Write it down — all four:
- What are you counting?
- Which method — mark-recapture, or quadrat sampling?
- List your steps. At least three.
- Name one thing that could go wrong.